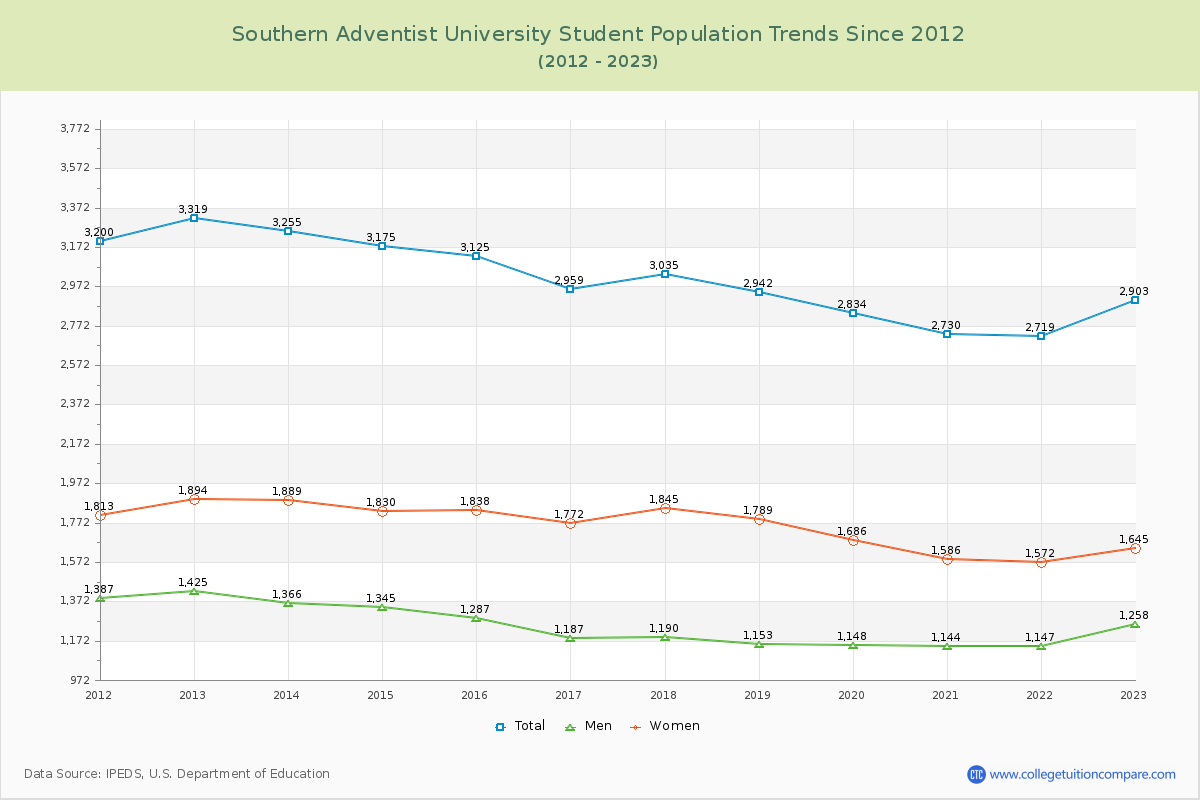
Student Population Changes
The average student population over the last 12 years is 3,000 where 2,903 students are attending the school for the academic year 2022-2023.
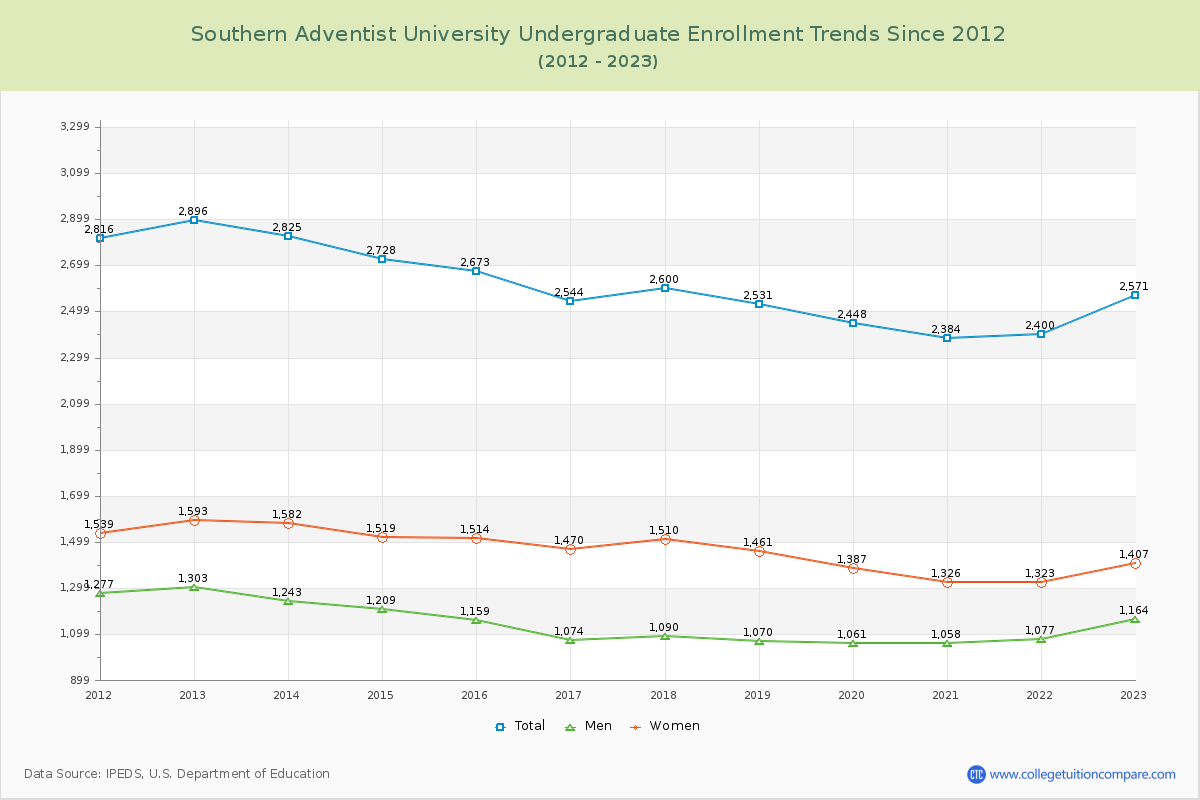
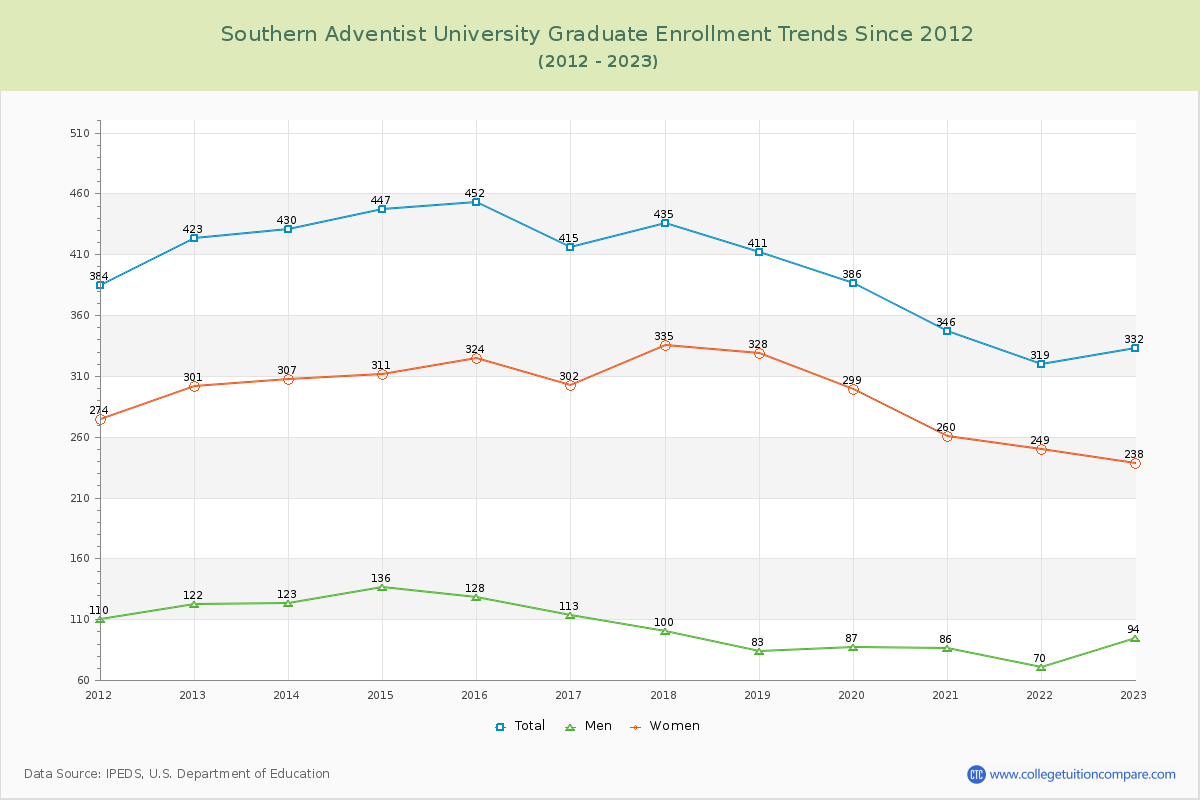
88.56% of total students is undergraduate students and 11.44% students is graduate students. The number of undergraduate students has decreased by 325 and the graduate enrollment has decreased by 91 over past 10 years.
The female to male ratio is 1.31 to 1 and it means that there are more female students enrolled in Southern Adventist than male students.
The following table and chart illustrate the changes in student population by gender at Southern Adventist University since 2012.
| Year | Total | Undergraduate | Graduate | ||||
|---|---|---|---|---|---|---|---|
| Total | Men | Women | Total | Men | Women | ||
| 2012-13 | 3,319 | 2,896 | 1,303 | 1,593 | 423 | 122 | 301 |
| 2013-14 | 3,255 -64 | 2,825 -71 | 1,243 -60 | 1,582 -11 | 430 7 | 123 1 | 307 6 |
| 2014-15 | 3,175 -80 | 2,728 -97 | 1,209 -34 | 1,519 -63 | 447 17 | 136 13 | 311 4 |
| 2015-16 | 3,125 -50 | 2,673 -55 | 1,159 -50 | 1,514 -5 | 452 5 | 128 -8 | 324 13 |
| 2016-17 | 2,959 -166 | 2,544 -129 | 1,074 -85 | 1,470 -44 | 415 -37 | 113 -15 | 302 -22 |
| 2017-18 | 3,035 76 | 2,600 56 | 1,090 16 | 1,510 40 | 435 20 | 100 -13 | 335 33 |
| 2018-19 | 2,942 -93 | 2,531 -69 | 1,070 -20 | 1,461 -49 | 411 -24 | 83 -17 | 328 -7 |
| 2019-20 | 2,834 -108 | 2,448 -83 | 1,061 -9 | 1,387 -74 | 386 -25 | 87 4 | 299 -29 |
| 2020-21 | 2,730 -104 | 2,384 -64 | 1,058 -3 | 1,326 -61 | 346 -40 | 86 -1 | 260 -39 |
| 2021-22 | 2,719 -11 | 2,400 16 | 1,077 19 | 1,323 -3 | 319 -27 | 70 -16 | 249 -11 |
| 2022-23 | 2,903 184 | 2,571 171 | 1,164 87 | 1,407 84 | 332 13 | 94 24 | 238 -11 |
| Average | 3,000 | 2,600 | 1,137 | 1,463 | 400 | 104 | 296 |