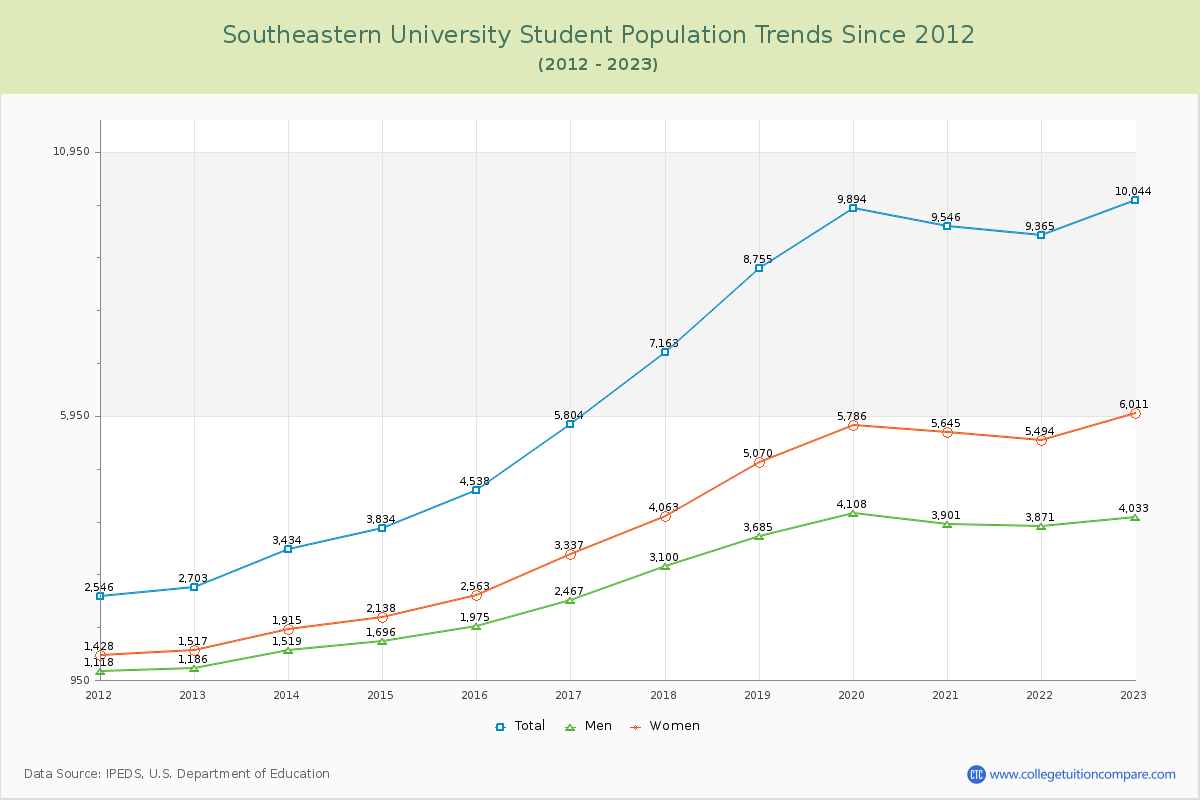
Student Population Changes
The average student population over the last 12 years is 6,825 where 10,044 students are attending the school for the academic year 2022-2023.
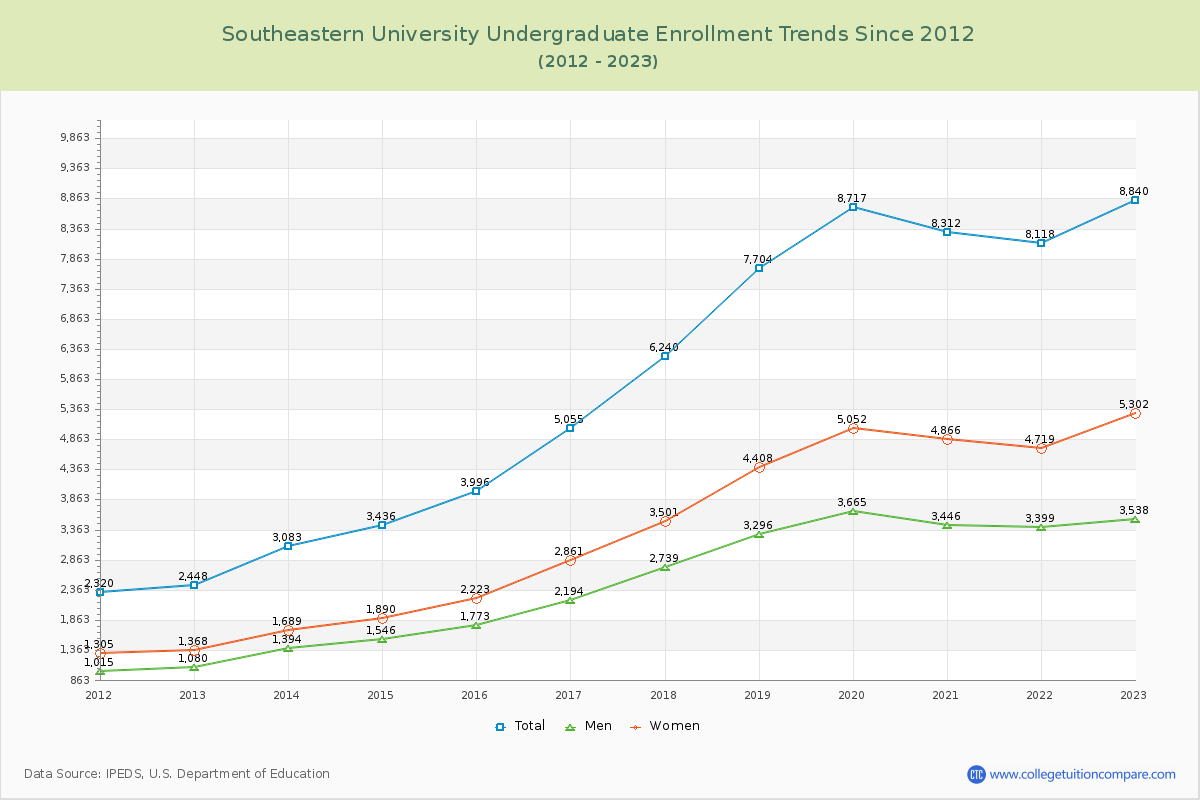
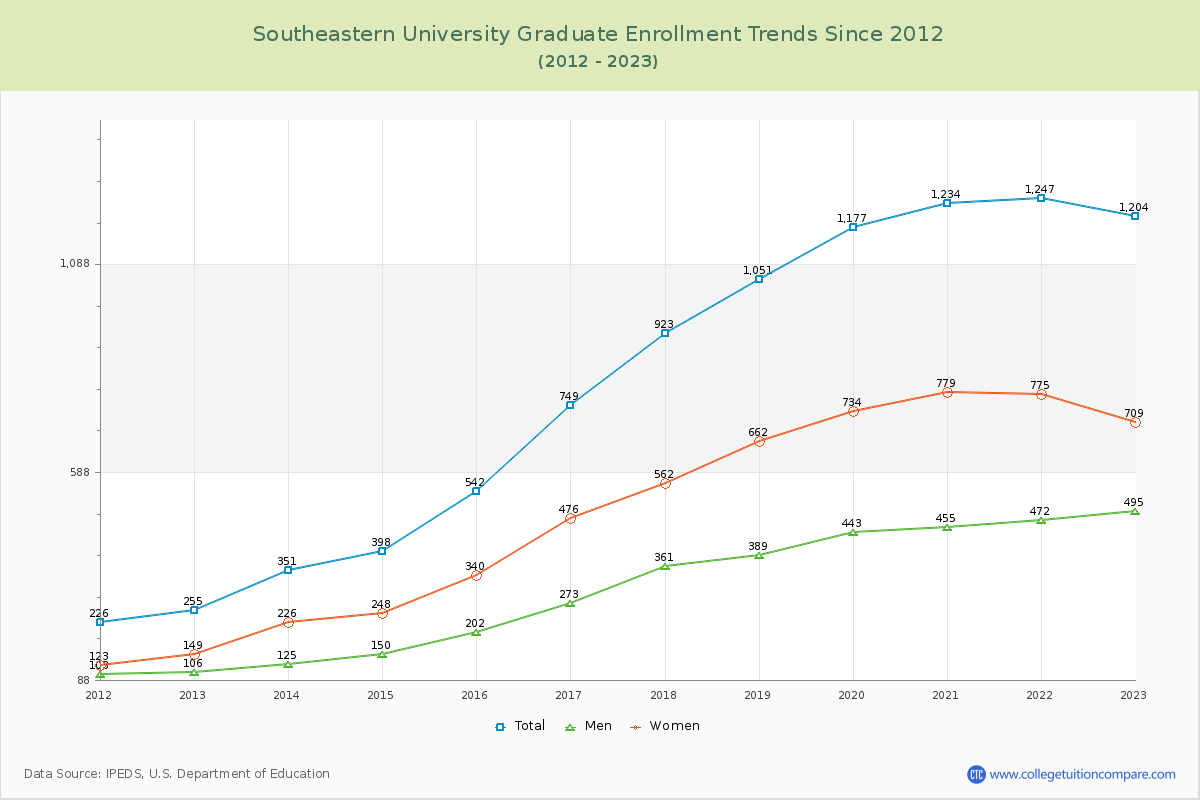
88.01% of total students is undergraduate students and 11.99% students is graduate students. The number of undergraduate students has increased by 6,392 and the graduate enrollment has increased by 949 over past 10 years.
The female to male ratio is 1.49 to 1 and it means that there are more female students enrolled in SEU than male students.
The following table and chart illustrate the changes in student population by gender at Southeastern University since 2012.
| Year | Total | Undergraduate | Graduate | ||||
|---|---|---|---|---|---|---|---|
| Total | Men | Women | Total | Men | Women | ||
| 2012-13 | 2,703 | 2,448 | 1,080 | 1,368 | 255 | 106 | 149 |
| 2013-14 | 3,434 731 | 3,083 635 | 1,394 314 | 1,689 321 | 351 96 | 125 19 | 226 77 |
| 2014-15 | 3,834 400 | 3,436 353 | 1,546 152 | 1,890 201 | 398 47 | 150 25 | 248 22 |
| 2015-16 | 4,538 704 | 3,996 560 | 1,773 227 | 2,223 333 | 542 144 | 202 52 | 340 92 |
| 2016-17 | 5,804 1,266 | 5,055 1,059 | 2,194 421 | 2,861 638 | 749 207 | 273 71 | 476 136 |
| 2017-18 | 7,163 1,359 | 6,240 1,185 | 2,739 545 | 3,501 640 | 923 174 | 361 88 | 562 86 |
| 2018-19 | 8,755 1,592 | 7,704 1,464 | 3,296 557 | 4,408 907 | 1,051 128 | 389 28 | 662 100 |
| 2019-20 | 9,894 1,139 | 8,717 1,013 | 3,665 369 | 5,052 644 | 1,177 126 | 443 54 | 734 72 |
| 2020-21 | 9,546 -348 | 8,312 -405 | 3,446 -219 | 4,866 -186 | 1,234 57 | 455 12 | 779 45 |
| 2021-22 | 9,365 -181 | 8,118 -194 | 3,399 -47 | 4,719 -147 | 1,247 13 | 472 17 | 775 -4 |
| 2022-23 | 10,044 679 | 8,840 722 | 3,538 139 | 5,302 583 | 1,204 -43 | 495 23 | 709 -66 |
| Average | 6,825 | 5,995 | 2,552 | 3,444 | 830 | 316 | 515 |