Enrollment Trends at SEARK College

-632

Total Enrollment

-94

Men

-538

Women

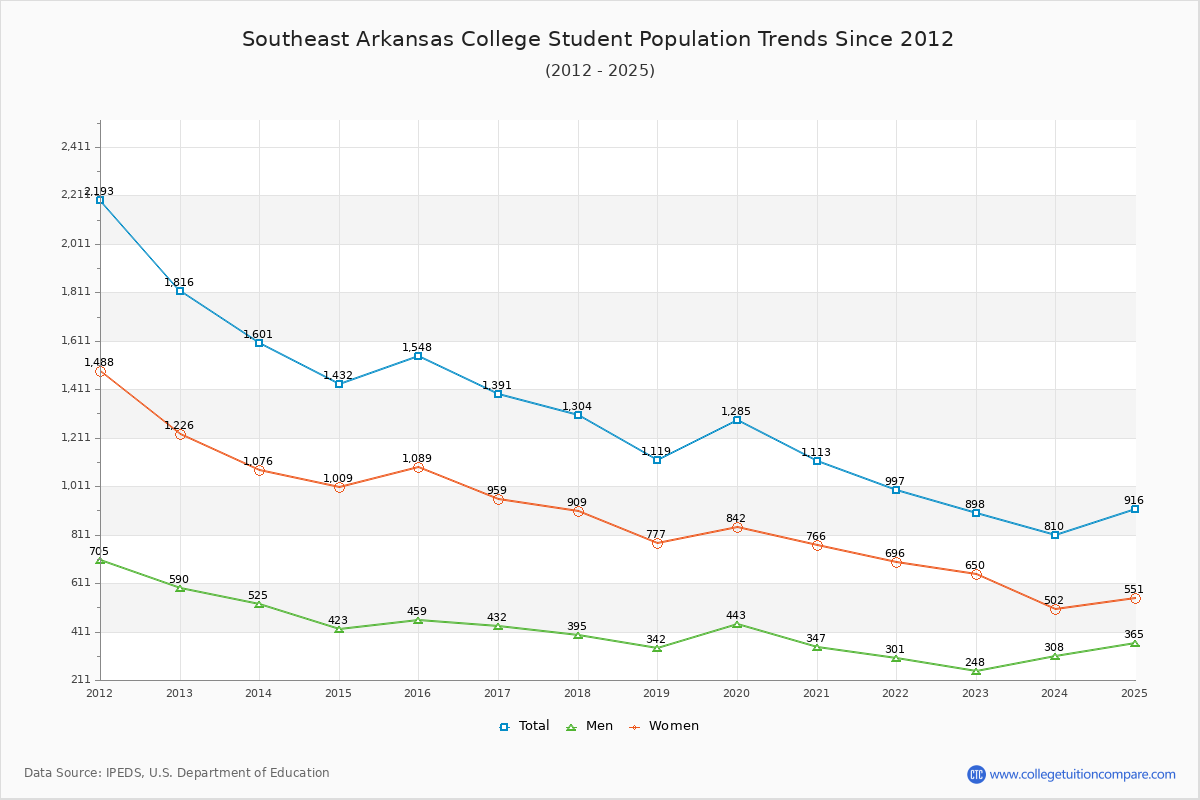
The student population at Southeast Arkansas College is 916 (all undergraduate). The number of students has decreased by 632 over the past decade.

The female to male ratio is 1.51 to 1 which means that female students enrolled more than male students.

344 students enrolled in online degree program exclusively and the number of online students has increased by 309.52% since 2015.

Student Population Changes

The average student population over the last 11 years is 1,138 where 916 students are attending the school for the academic year 2024-2025.

The female to male ratio is 1.51 to 1 and it means that there are more female students enrolled in SEARK College than male students.

The following table and chart illustrate the changes in student population by gender at Southeast Arkansas College since 2015.

YearTotalMenWomen
2015-161,5484591,089
2016-171,391
-157
432
-27
959
-130
2017-181,304
-87
395
-37
909
-50
2018-191,119
-185
342
-53
777
-132
2019-201,285
166
443
101
842
65
2020-211,113
-172
347
-96
766
-76
2021-22997
-116
301
-46
696
-70
2022-23898
-99
248
-53
650
-46
2023-24810
-88
308
60
502
-148
2024-25916
106
365
57
551
49
Average1,138364774
Southeast Arkansas College Enrollment Trends Chart

Enrollment by Race/Ethnicity Changes

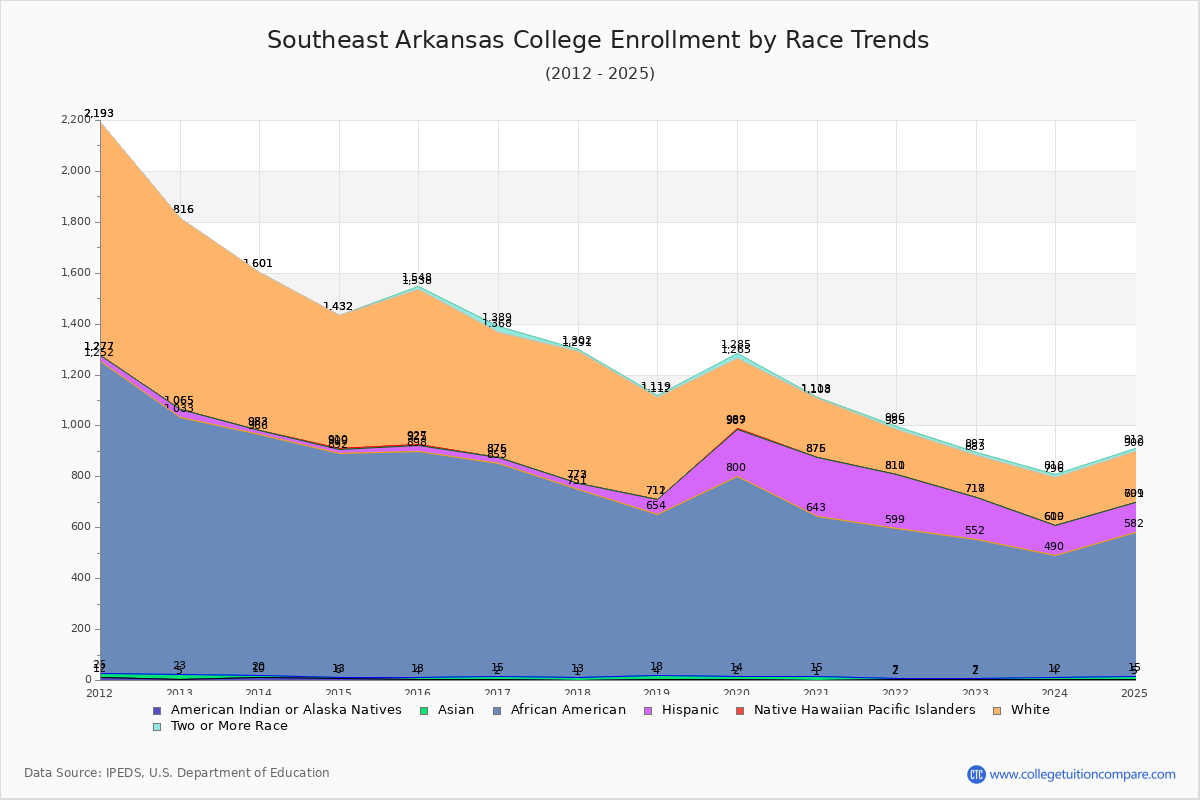
The percentage of white students is 21.72% and the percentage of black students is 61.90% at Southeast Arkansas College. 1.09% of enrolled students is Asian. Hispanic students comprise 12.77% of the student body.

Over the past 10 years, the racial composition has shifted. The percentage of white students decreased from 39.47% to 21.72%. Asian enrollment grew from 0.58% to 1.09%. Black student enrollment increased from 57.17% to 61.90%. Hispanic student representation expanded from 1.74% to 12.77%.

The overall racial diversity, measured by the Census Bureau Diversity Index, is 0.5530 which indicates that moderately diverse. This increased from 0.5170 a decade ago, suggesting that racial diversity has improved.

The following table and chart illustrate the student population trends by race/ethnicity at Southeast Arkansas College over the past 11 years (2015-2025).

YearAmerican Indian or Native AmericanAsianBlackHispanicNative Hawaiian or Other Pacific IslanderWhiteTwo or More Races
2015-164988527261110
2016-1721383822149221
2017-1811273821151811
2018-194146365714007
2019-20212786187227620
2020-2111462823212325
2021-2225592211117411
2022-2325545165116514
2023-2448478119118614
2024-25510567117219912
Average310669116132513
Southeast Arkansas College Enrollment by Race Trends Chart

Distance Learning (Online Courses) Enrollment Changes

344 students are enrolled in online degree programs exclusively for the academic year 2024-2025, which is 38% of total students. The number of online students has increased 309.52% since 2015. The following table and chart illustrate the changes in the online student population by enrolled type at Southeast Arkansas College from 2015 to 2025.

YearTotal EnrollmentOnline CompletelyEnrolled in Some Online CoursesNot Enrolled in Online Courses
2015-161,548842571,207
2016-171,391623011,028
2017-181,30481294929
2018-191,11981265773
2019-201,285129284872
2020-211,113150397566
2021-22997290243464
2022-23898302178418
2023-24810295149366
2024-25916344159413
Average1,138182253704

Ratings & Review

Share your experiences and thoughts about Southeast Arkansas College. It will be a great help to applicants and prospective students!