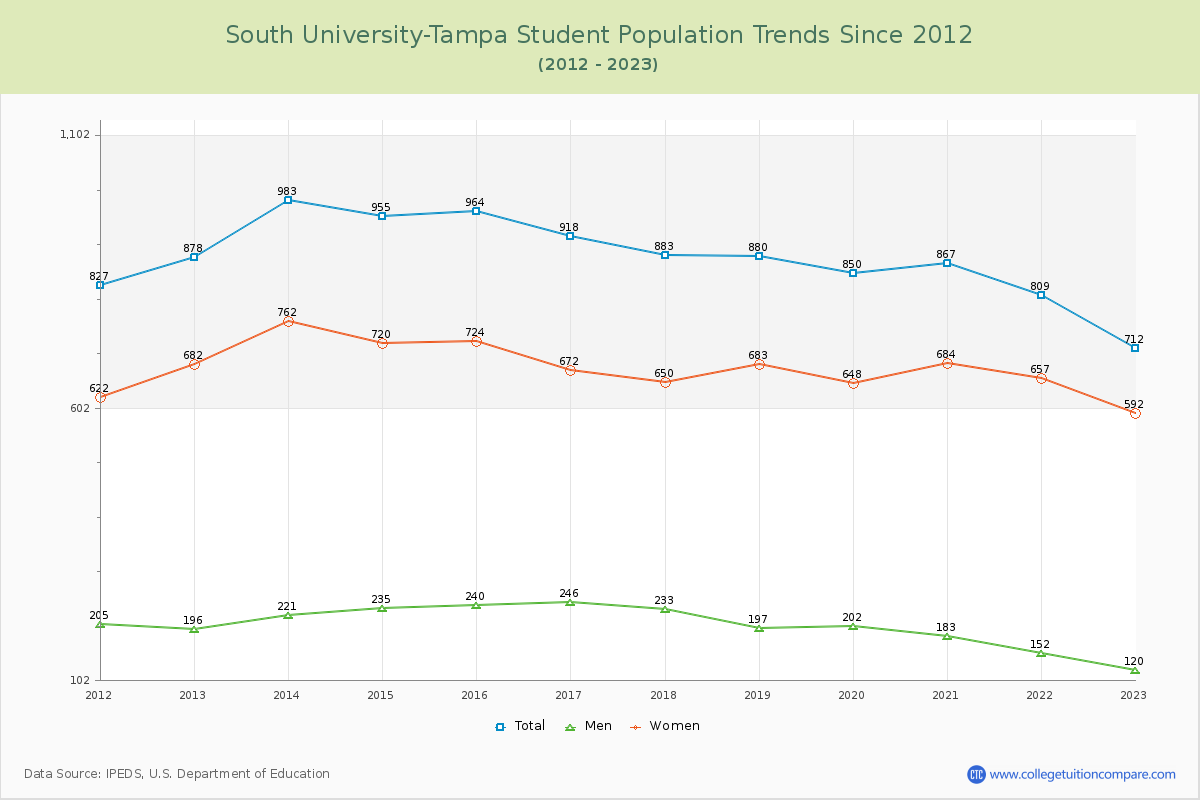
Student Population Changes
The average student population over the last 12 years is 882 where 712 students are attending the school for the academic year 2022-2023.
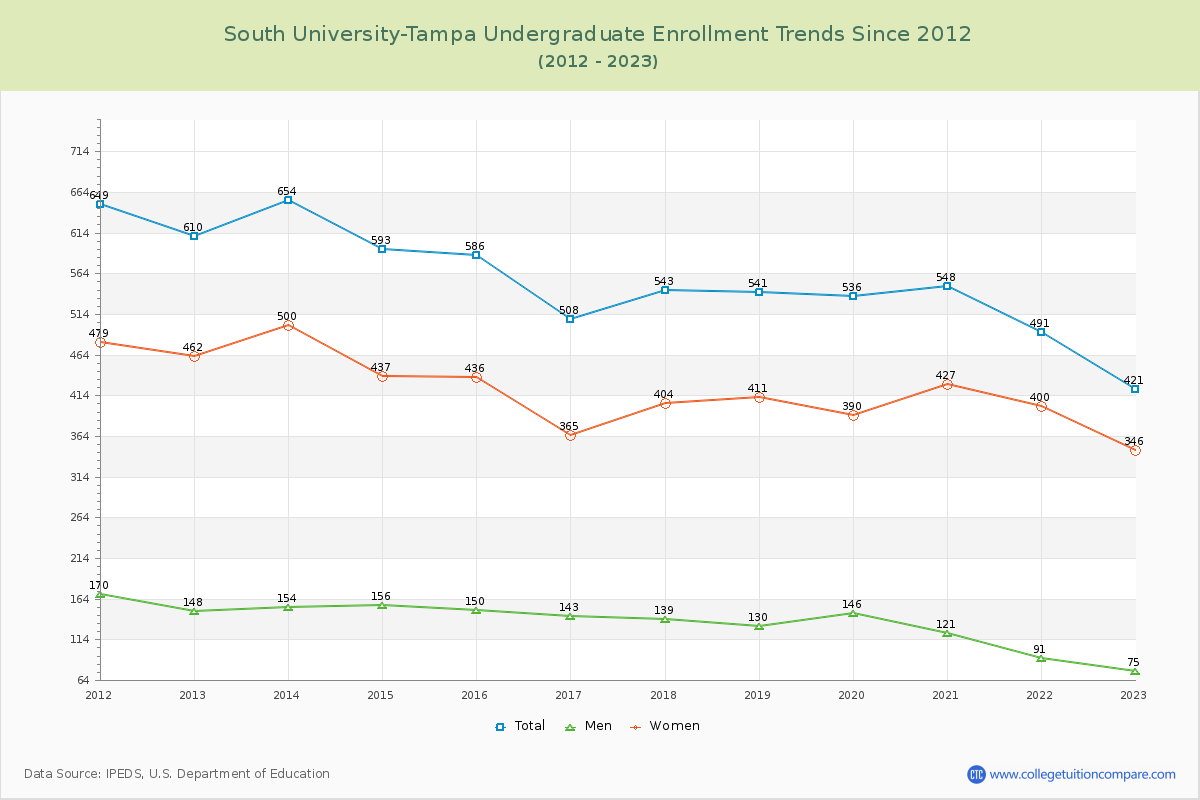
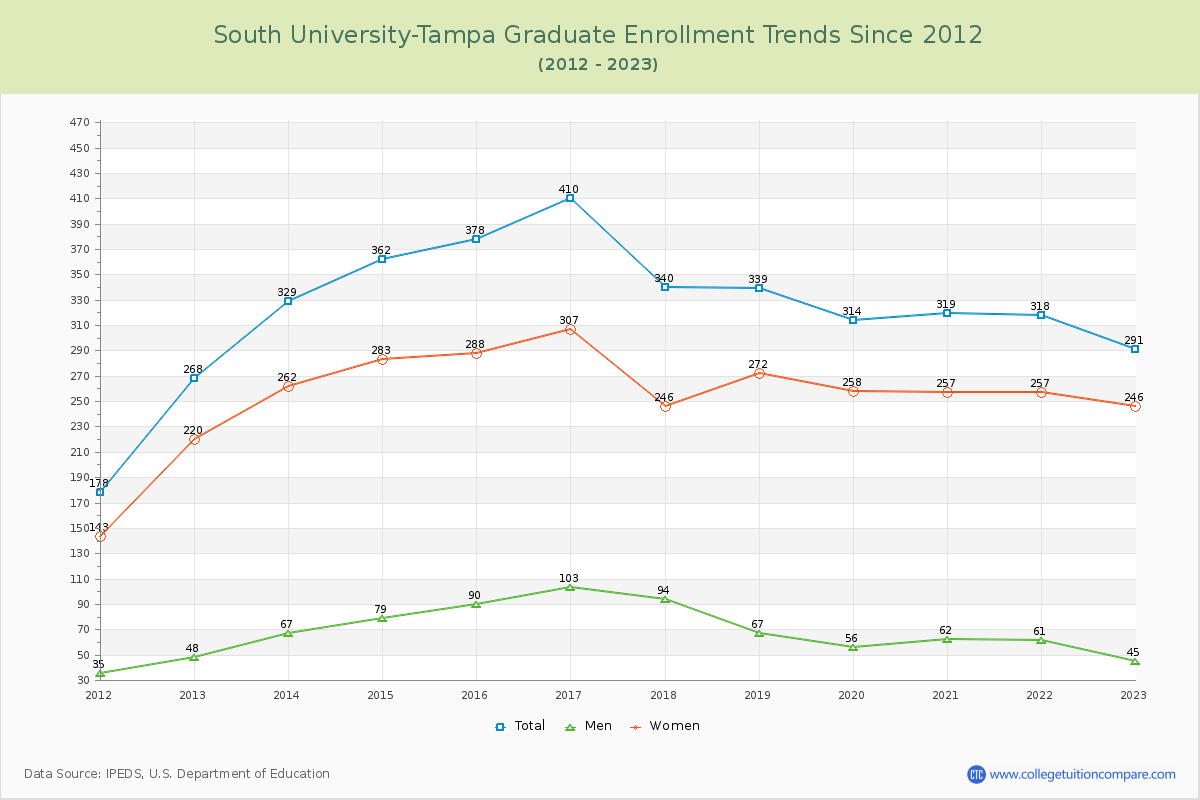
59.13% of total students is undergraduate students and 40.87% students is graduate students. The number of undergraduate students has decreased by 189 and the graduate enrollment has increased by 23 over past 10 years.
The female to male ratio is 4.93 to 1 and it means that there are far more female students enrolled in South University-Tampa than male students.
The following table and chart illustrate the changes in student population by gender at South University-Tampa since 2012.
| Year | Total | Undergraduate | Graduate | ||||
|---|---|---|---|---|---|---|---|
| Total | Men | Women | Total | Men | Women | ||
| 2012-13 | 878 | 610 | 148 | 462 | 268 | 48 | 220 |
| 2013-14 | 983 105 | 654 44 | 154 6 | 500 38 | 329 61 | 67 19 | 262 42 |
| 2014-15 | 955 -28 | 593 -61 | 156 2 | 437 -63 | 362 33 | 79 12 | 283 21 |
| 2015-16 | 964 9 | 586 -7 | 150 -6 | 436 -1 | 378 16 | 90 11 | 288 5 |
| 2016-17 | 918 -46 | 508 -78 | 143 -7 | 365 -71 | 410 32 | 103 13 | 307 19 |
| 2017-18 | 883 -35 | 543 35 | 139 -4 | 404 39 | 340 -70 | 94 -9 | 246 -61 |
| 2018-19 | 880 -3 | 541 -2 | 130 -9 | 411 7 | 339 -1 | 67 -27 | 272 26 |
| 2019-20 | 850 -30 | 536 -5 | 146 16 | 390 -21 | 314 -25 | 56 -11 | 258 -14 |
| 2020-21 | 867 17 | 548 12 | 121 -25 | 427 37 | 319 5 | 62 6 | 257 -1 |
| 2021-22 | 809 -58 | 491 -57 | 91 -30 | 400 -27 | 318 -1 | 61 -1 | 257 0 |
| 2022-23 | 712 -97 | 421 -70 | 75 -16 | 346 -54 | 291 -27 | 45 -16 | 246 -11 |
| Average | 882 | 548 | 132 | 416 | 333 | 70 | 263 |