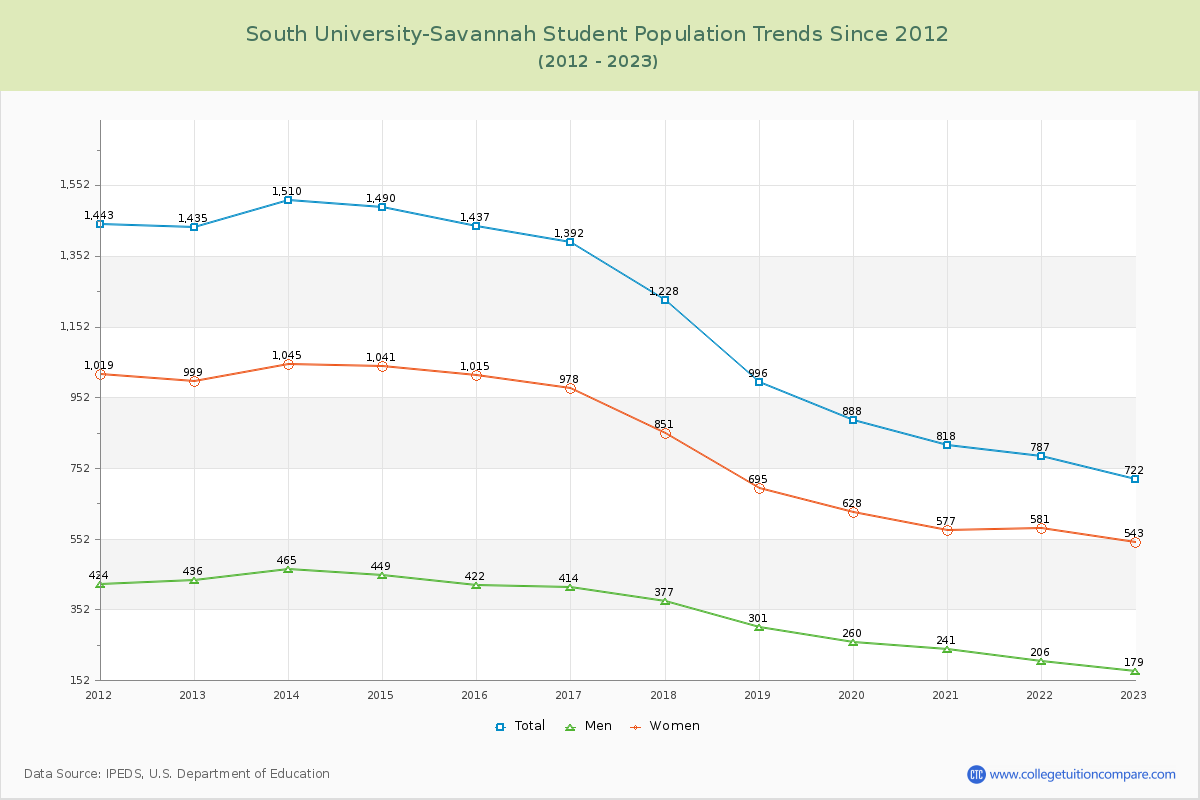
Student Population Changes
The average student population over the last 12 years is 1,155 where 722 students are attending the school for the academic year 2022-2023.
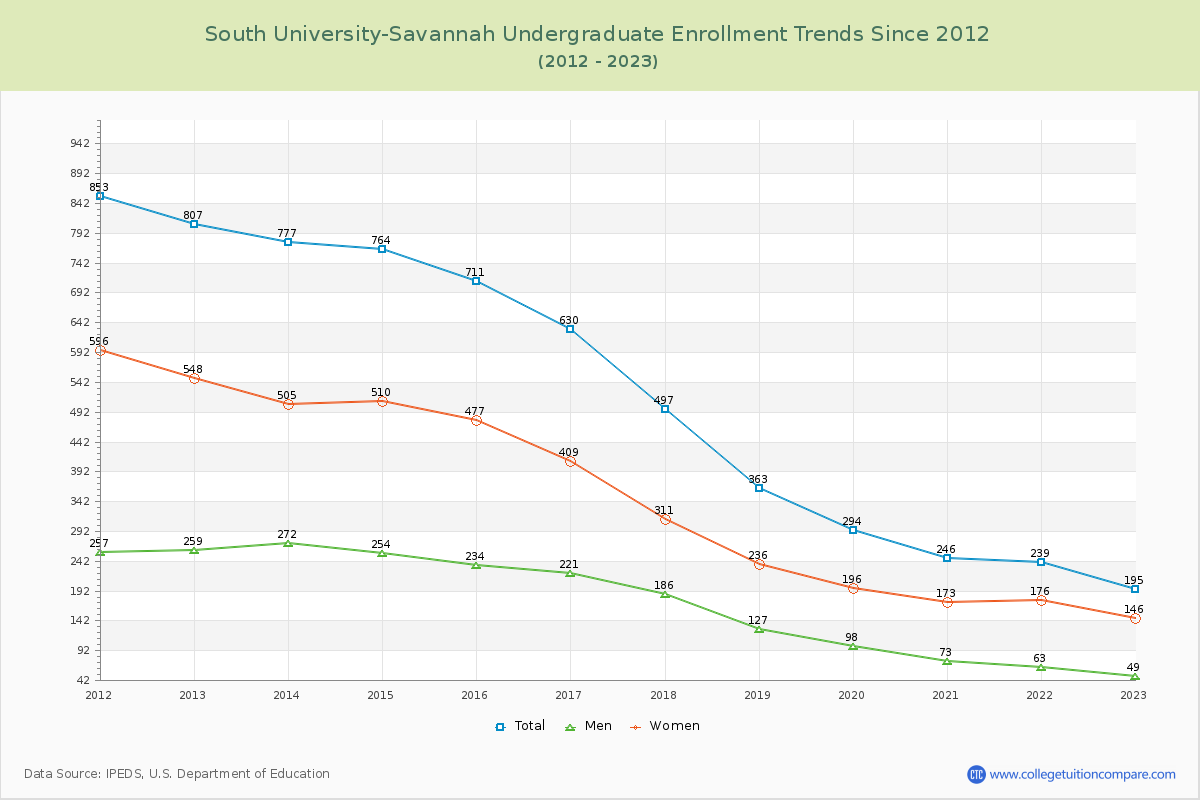
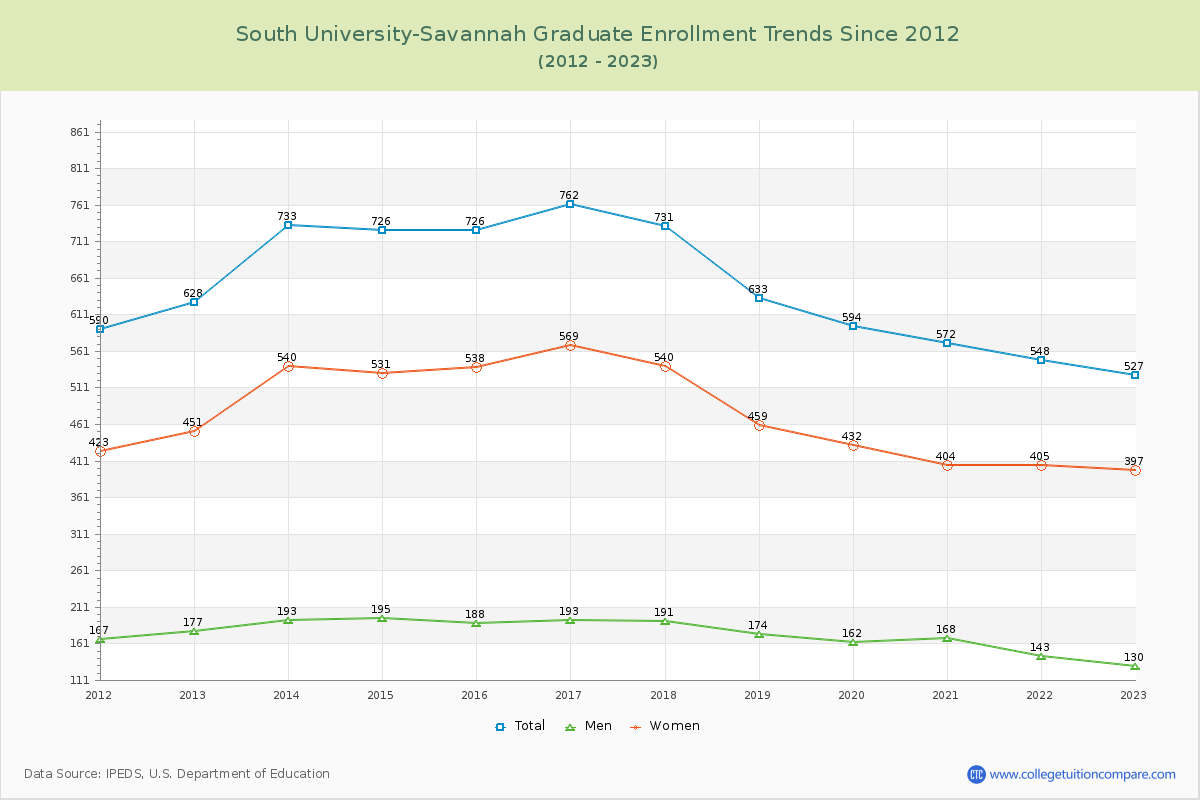
27.01% of total students is undergraduate students and 72.99% students is graduate students. The number of undergraduate students has decreased by 612 and the graduate enrollment has decreased by 101 over past 10 years.
The female to male ratio is 3.03 to 1 and it means that there are far more female students enrolled in South University-Savannah than male students.
The following table and chart illustrate the changes in student population by gender at South University-Savannah since 2012.
| Year | Total | Undergraduate | Graduate | ||||
|---|---|---|---|---|---|---|---|
| Total | Men | Women | Total | Men | Women | ||
| 2012-13 | 1,435 | 807 | 259 | 548 | 628 | 177 | 451 |
| 2013-14 | 1,510 75 | 777 -30 | 272 13 | 505 -43 | 733 105 | 193 16 | 540 89 |
| 2014-15 | 1,490 -20 | 764 -13 | 254 -18 | 510 5 | 726 -7 | 195 2 | 531 -9 |
| 2015-16 | 1,437 -53 | 711 -53 | 234 -20 | 477 -33 | 726 0 | 188 -7 | 538 7 |
| 2016-17 | 1,392 -45 | 630 -81 | 221 -13 | 409 -68 | 762 36 | 193 5 | 569 31 |
| 2017-18 | 1,228 -164 | 497 -133 | 186 -35 | 311 -98 | 731 -31 | 191 -2 | 540 -29 |
| 2018-19 | 996 -232 | 363 -134 | 127 -59 | 236 -75 | 633 -98 | 174 -17 | 459 -81 |
| 2019-20 | 888 -108 | 294 -69 | 98 -29 | 196 -40 | 594 -39 | 162 -12 | 432 -27 |
| 2020-21 | 818 -70 | 246 -48 | 73 -25 | 173 -23 | 572 -22 | 168 6 | 404 -28 |
| 2021-22 | 787 -31 | 239 -7 | 63 -10 | 176 3 | 548 -24 | 143 -25 | 405 1 |
| 2022-23 | 722 -65 | 195 -44 | 49 -14 | 146 -30 | 527 -21 | 130 -13 | 397 -8 |
| Average | 1,155 | 502 | 167 | 335 | 653 | 174 | 479 |