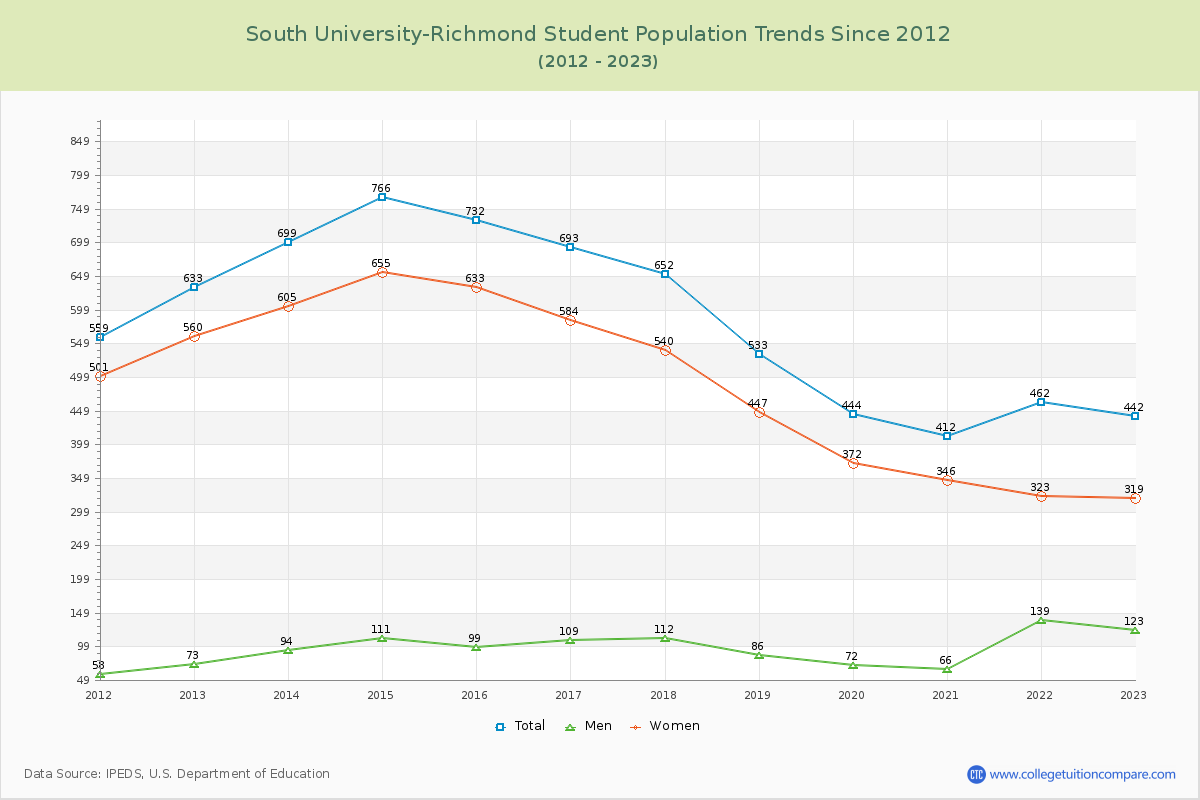
Student Population Changes
The average student population over the last 12 years is 588 where 442 students are attending the school for the academic year 2022-2023.
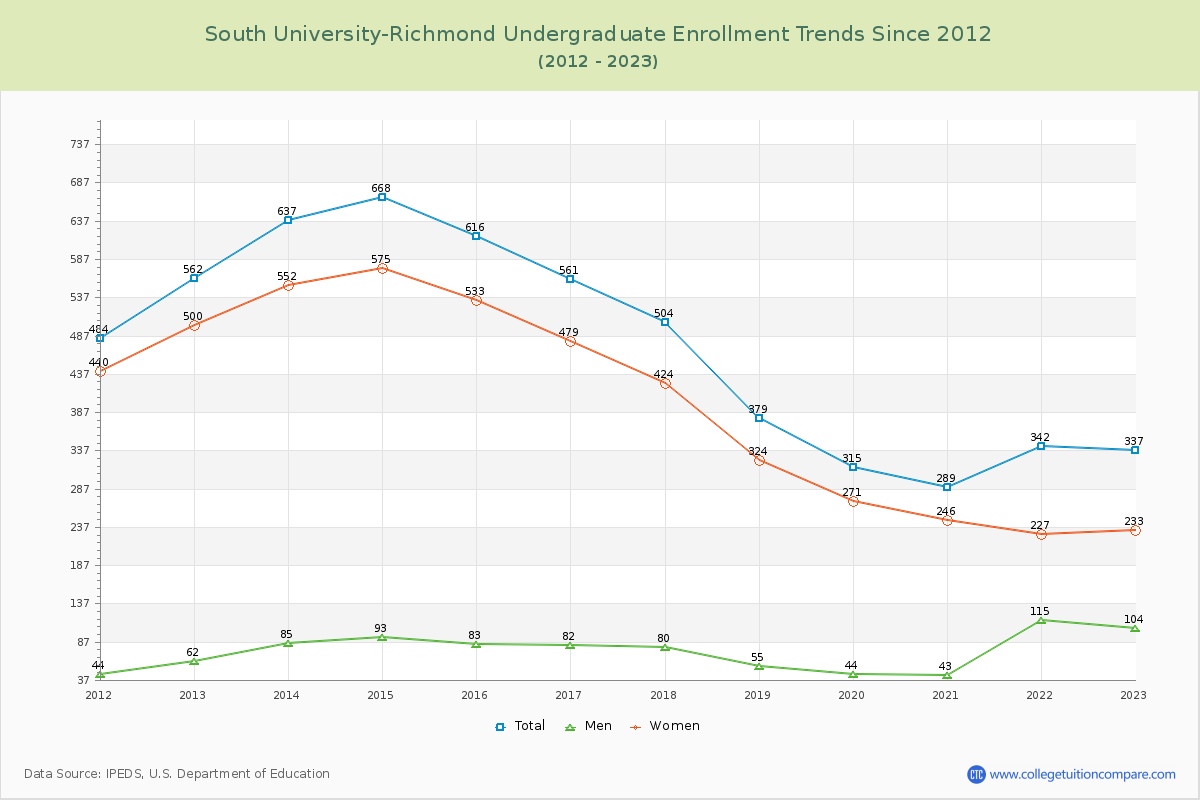
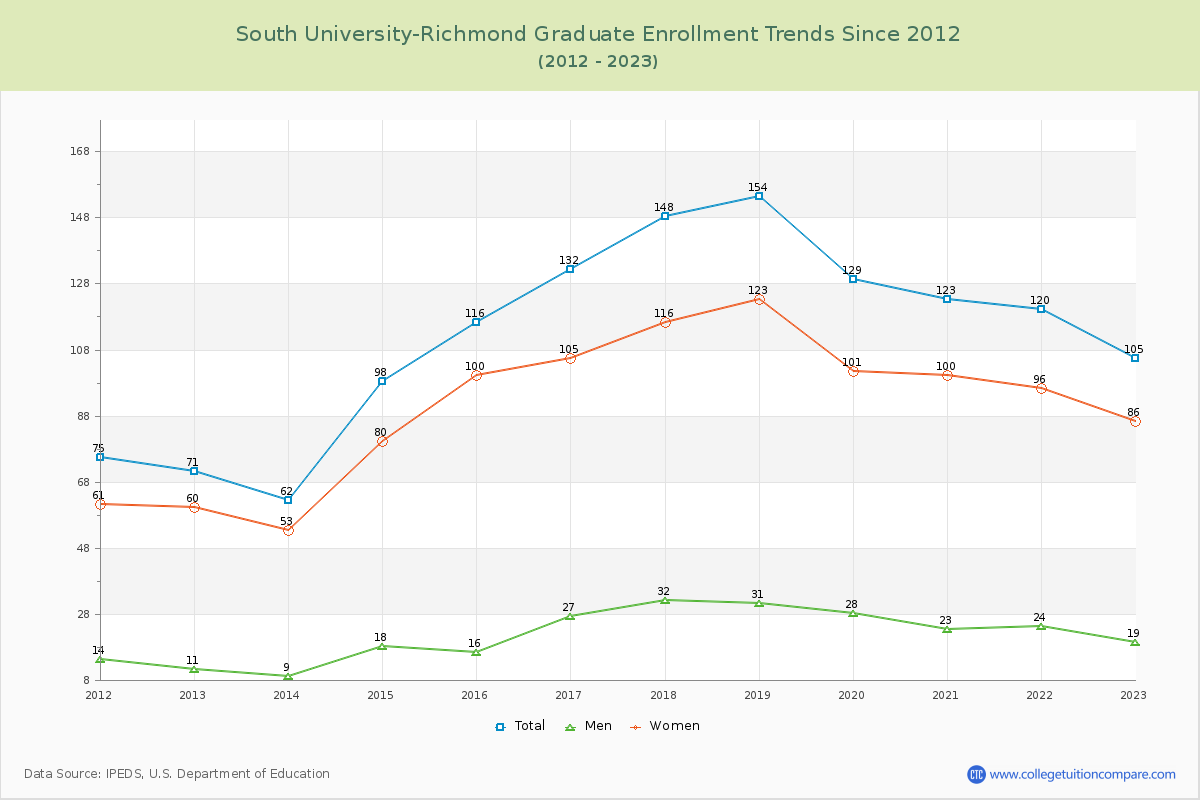
76.24% of total students is undergraduate students and 23.76% students is graduate students. The number of undergraduate students has decreased by 225 and the graduate enrollment has increased by 34 over past 10 years.
The female to male ratio is 2.59 to 1 and it means that there are far more female students enrolled in South University-Richmond than male students.
The following table and chart illustrate the changes in student population by gender at South University-Richmond since 2012.
| Year | Total | Undergraduate | Graduate | ||||
|---|---|---|---|---|---|---|---|
| Total | Men | Women | Total | Men | Women | ||
| 2012-13 | 633 | 562 | 62 | 500 | 71 | 11 | 60 |
| 2013-14 | 699 66 | 637 75 | 85 23 | 552 52 | 62 -9 | 9 -2 | 53 -7 |
| 2014-15 | 766 67 | 668 31 | 93 8 | 575 23 | 98 36 | 18 9 | 80 27 |
| 2015-16 | 732 -34 | 616 -52 | 83 -10 | 533 -42 | 116 18 | 16 -2 | 100 20 |
| 2016-17 | 693 -39 | 561 -55 | 82 -1 | 479 -54 | 132 16 | 27 11 | 105 5 |
| 2017-18 | 652 -41 | 504 -57 | 80 -2 | 424 -55 | 148 16 | 32 5 | 116 11 |
| 2018-19 | 533 -119 | 379 -125 | 55 -25 | 324 -100 | 154 6 | 31 -1 | 123 7 |
| 2019-20 | 444 -89 | 315 -64 | 44 -11 | 271 -53 | 129 -25 | 28 -3 | 101 -22 |
| 2020-21 | 412 -32 | 289 -26 | 43 -1 | 246 -25 | 123 -6 | 23 -5 | 100 -1 |
| 2021-22 | 462 50 | 342 53 | 115 72 | 227 -19 | 120 -3 | 24 1 | 96 -4 |
| 2022-23 | 442 -20 | 337 -5 | 104 -11 | 233 6 | 105 -15 | 19 -5 | 86 -10 |
| Average | 588 | 474 | 77 | 397 | 114 | 22 | 93 |