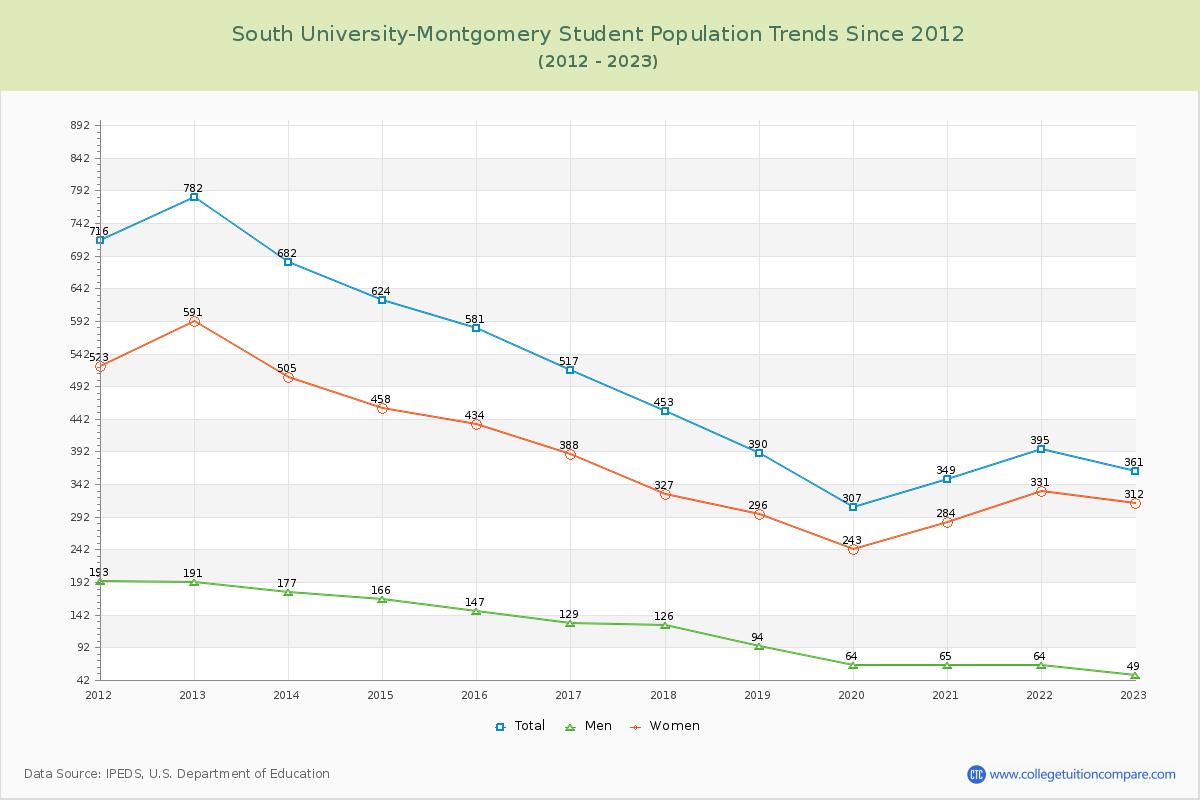
Student Population Changes
The average student population over the last 12 years is 495 where 361 students are attending the school for the academic year 2022-2023.
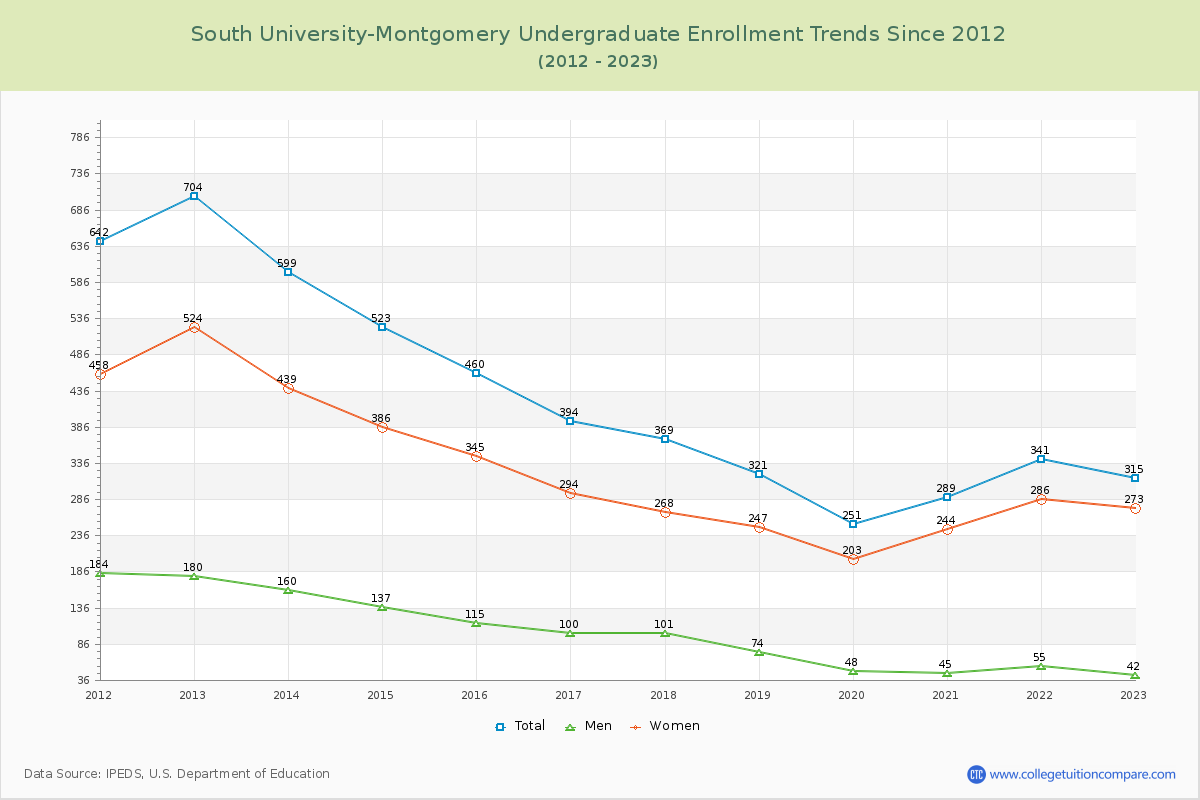
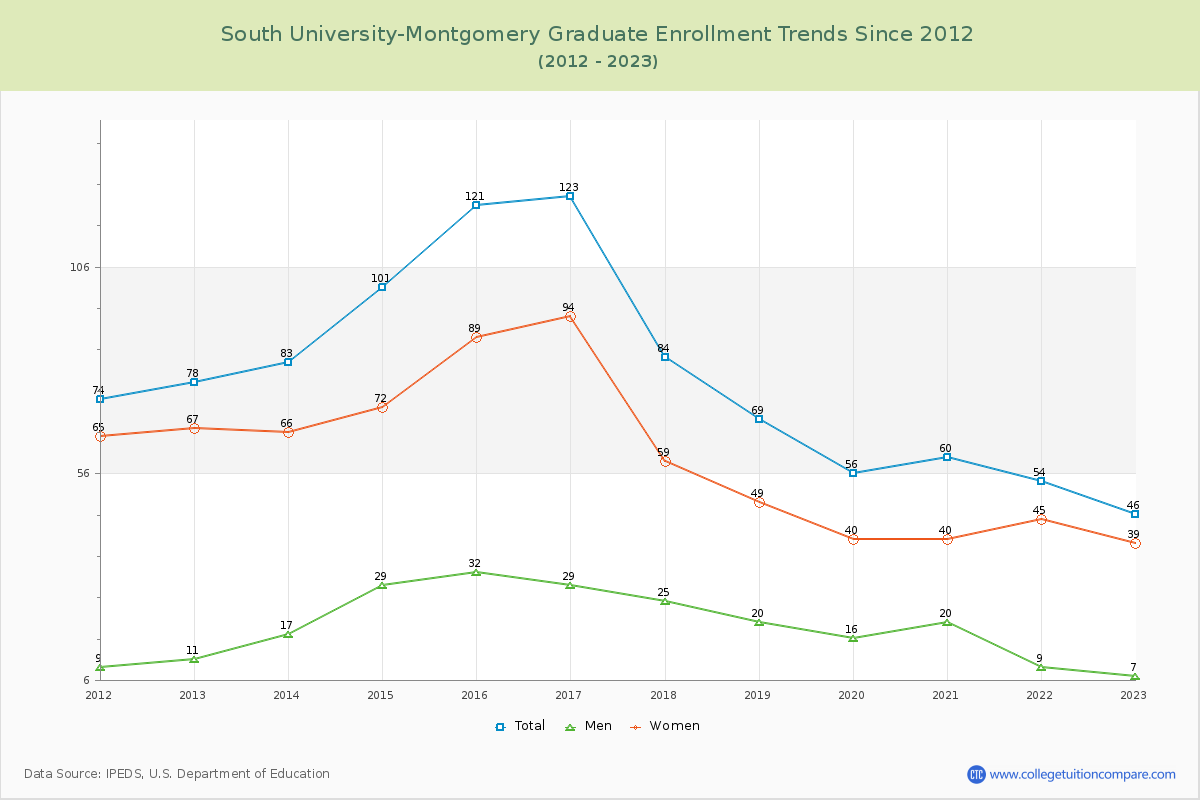
87.26% of total students is undergraduate students and 12.74% students is graduate students. The number of undergraduate students has decreased by 389 and the graduate enrollment has decreased by 32 over past 10 years.
The female to male ratio is 6.37 to 1 and it means that there are far more female students enrolled in South University-Montgomery than male students.
The following table and chart illustrate the changes in student population by gender at South University-Montgomery since 2012.
| Year | Total | Undergraduate | Graduate | ||||
|---|---|---|---|---|---|---|---|
| Total | Men | Women | Total | Men | Women | ||
| 2012-13 | 782 | 704 | 180 | 524 | 78 | 11 | 67 |
| 2013-14 | 682 -100 | 599 -105 | 160 -20 | 439 -85 | 83 5 | 17 6 | 66 -1 |
| 2014-15 | 624 -58 | 523 -76 | 137 -23 | 386 -53 | 101 18 | 29 12 | 72 6 |
| 2015-16 | 581 -43 | 460 -63 | 115 -22 | 345 -41 | 121 20 | 32 3 | 89 17 |
| 2016-17 | 517 -64 | 394 -66 | 100 -15 | 294 -51 | 123 2 | 29 -3 | 94 5 |
| 2017-18 | 453 -64 | 369 -25 | 101 1 | 268 -26 | 84 -39 | 25 -4 | 59 -35 |
| 2018-19 | 390 -63 | 321 -48 | 74 -27 | 247 -21 | 69 -15 | 20 -5 | 49 -10 |
| 2019-20 | 307 -83 | 251 -70 | 48 -26 | 203 -44 | 56 -13 | 16 -4 | 40 -9 |
| 2020-21 | 349 42 | 289 38 | 45 -3 | 244 41 | 60 4 | 20 4 | 40 0 |
| 2021-22 | 395 46 | 341 52 | 55 10 | 286 42 | 54 -6 | 9 -11 | 45 5 |
| 2022-23 | 361 -34 | 315 -26 | 42 -13 | 273 -13 | 46 -8 | 7 -2 | 39 -6 |
| Average | 495 | 415 | 96 | 319 | 80 | 20 | 60 |