Student Population Changes
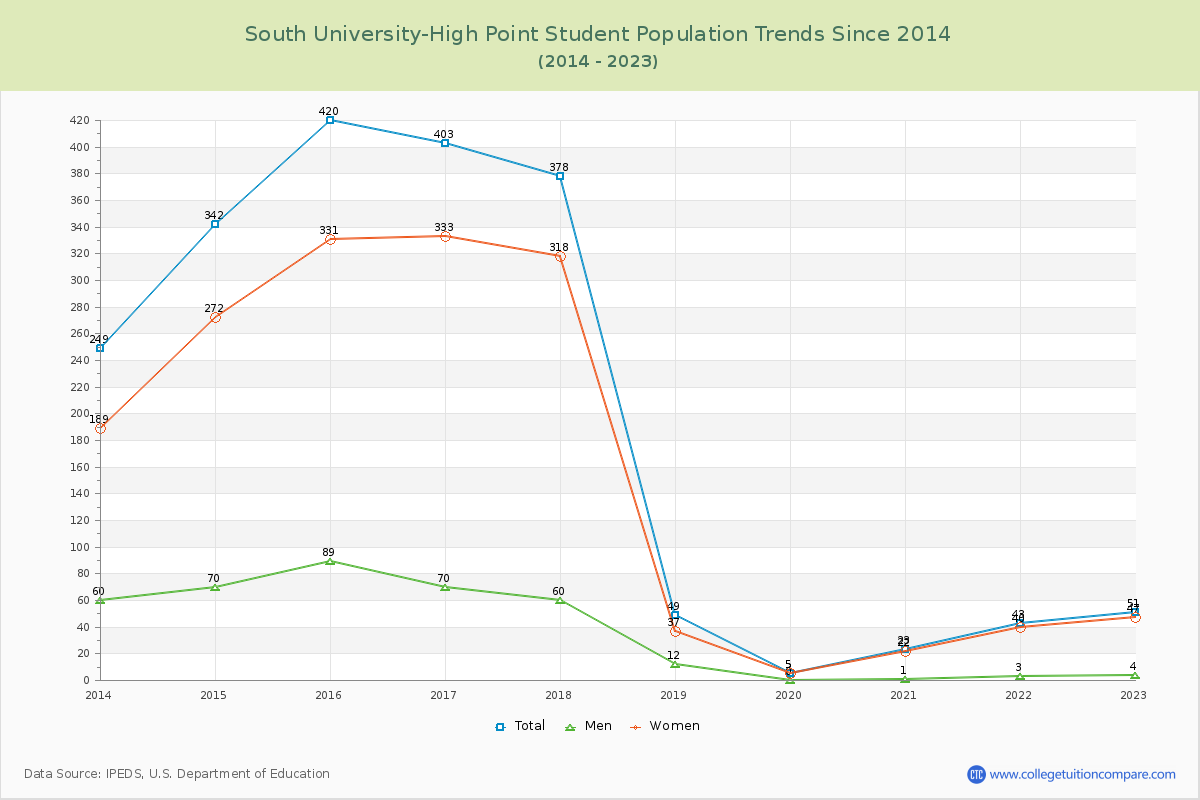
The average student population over the last 11 years is 196 where 51 students are attending the school for the academic year 2022-2023.
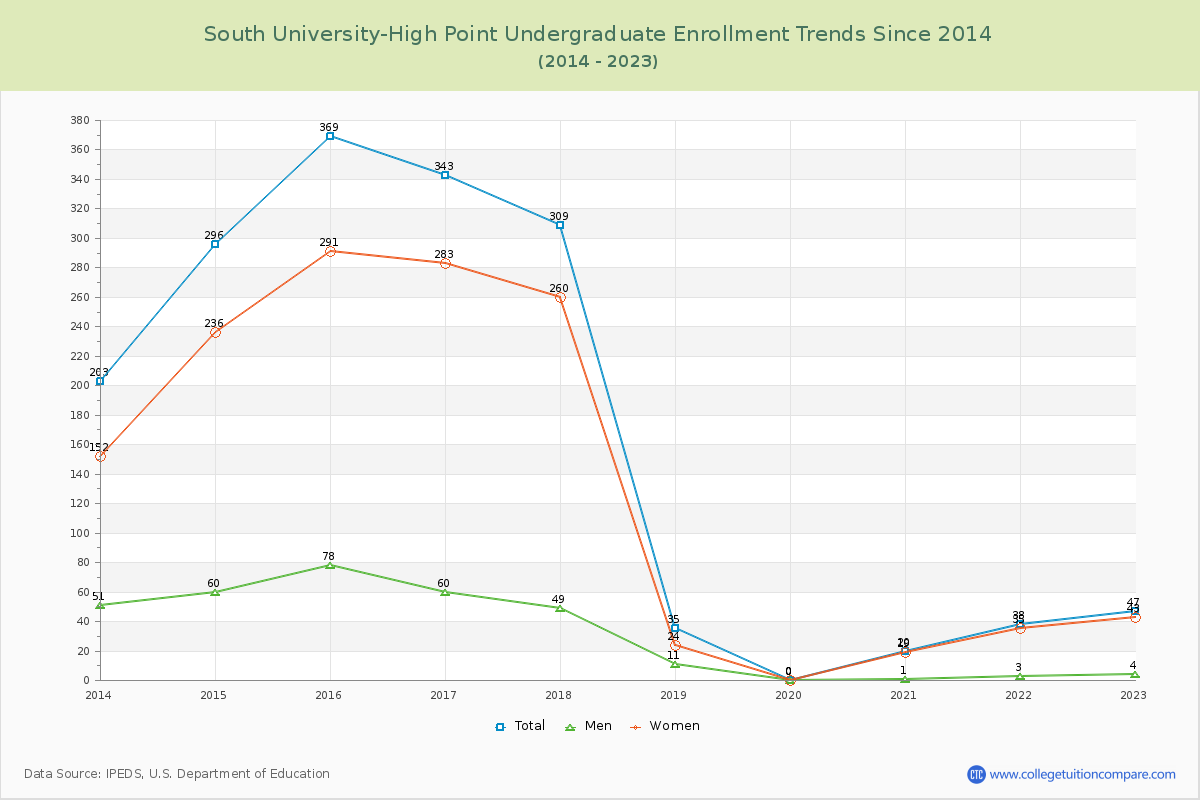
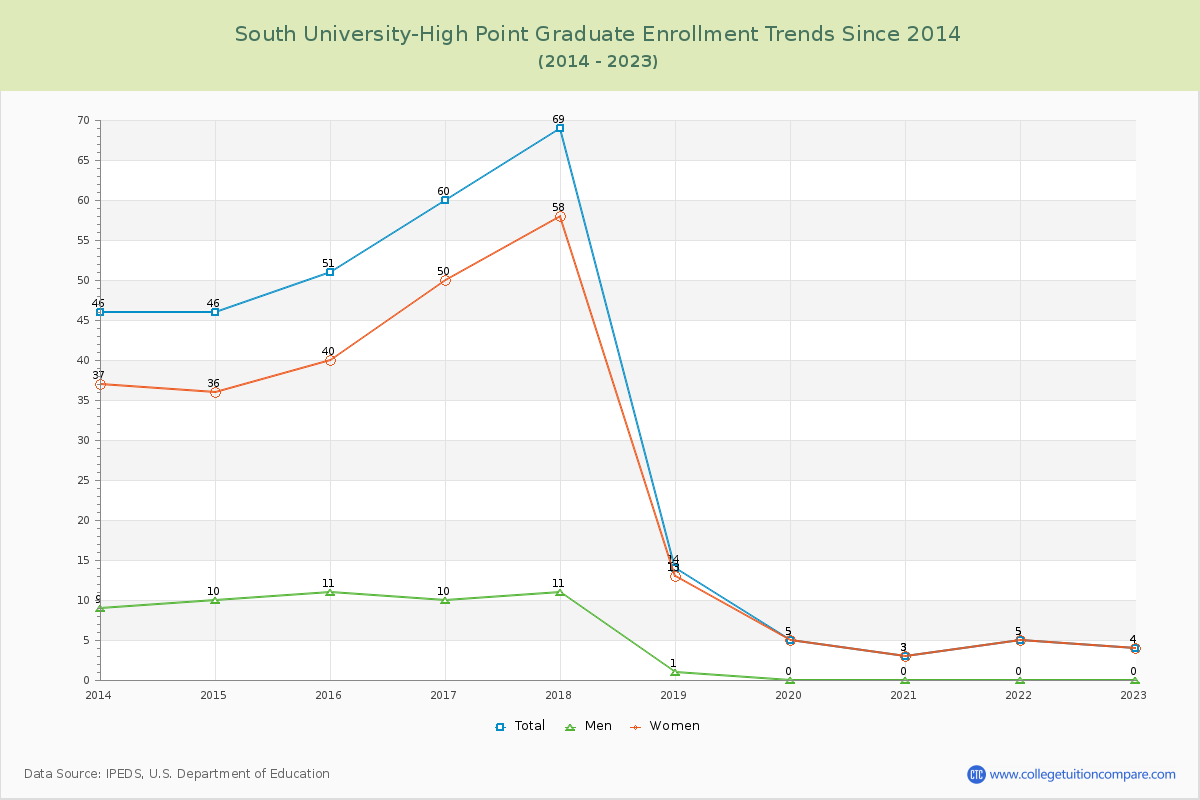
92.16% of total students is undergraduate students and 7.84% students is graduate students. The number of undergraduate students has decreased by 156 and the graduate enrollment has decreased by 42 over past 10 years.
The female to male ratio is 11.75 to 1 and it means that there are far more female students enrolled in South University-High Point than male students.
The following table and chart illustrate the changes in student population by gender at South University-High Point since 2013.
| Year | Total | Undergraduate | Graduate | ||||
|---|---|---|---|---|---|---|---|
| Total | Men | Women | Total | Men | Women | ||
| 2013-14 | 249 | 203 | 51 | 152 | 46 | 9 | 37 |
| 2014-15 | 342 93 | 296 93 | 60 9 | 236 84 | 46 0 | 10 1 | 36 -1 |
| 2015-16 | 420 78 | 369 73 | 78 18 | 291 55 | 51 5 | 11 1 | 40 4 |
| 2016-17 | 403 -17 | 343 -26 | 60 -18 | 283 -8 | 60 9 | 10 -1 | 50 10 |
| 2017-18 | 378 -25 | 309 -34 | 49 -11 | 260 -23 | 69 9 | 11 1 | 58 8 |
| 2018-19 | 49 -329 | 35 -274 | 11 -38 | 24 -236 | 14 -55 | 1 -10 | 13 -45 |
| 2019-20 | 5 -44 | 0 -35 | 0 -11 | 0 -24 | 5 -9 | 0 -1 | 5 -8 |
| 2020-21 | 23 18 | 20 20 | 1 1 | 19 19 | 3 -2 | 0 0 | 3 -2 |
| 2021-22 | 43 20 | 38 18 | 3 2 | 35 16 | 5 2 | 0 0 | 5 2 |
| 2022-23 | 51 8 | 47 9 | 4 1 | 43 8 | 4 -1 | 0 0 | 4 -1 |
| Average | 196 | 166 | 32 | 134 | 30 | 5 | 25 |