Enrollment Trends at South University-Columbia

-824

Total Enrollment

-201

Men

-623

Women

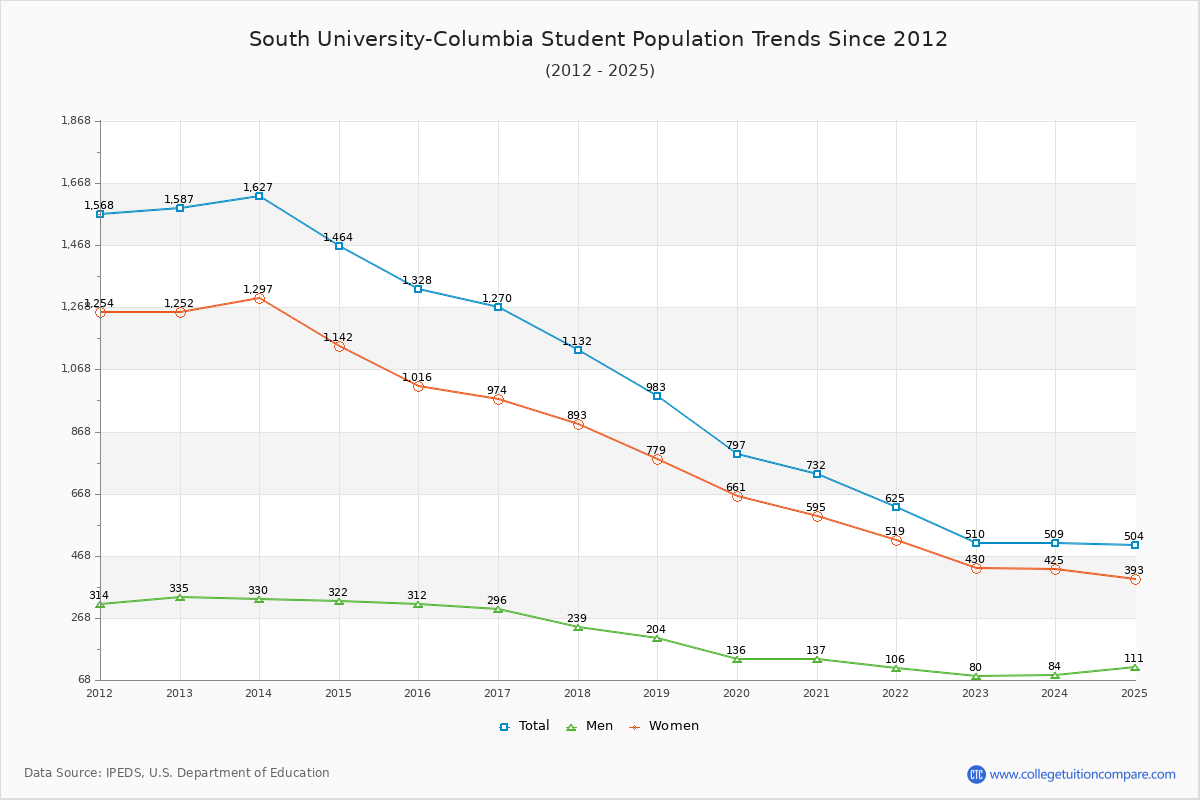
The student population at South University-Columbia is 504 (450 undergraduate and 54 graduate students) . The number of students has decreased by 824 over the past decade.

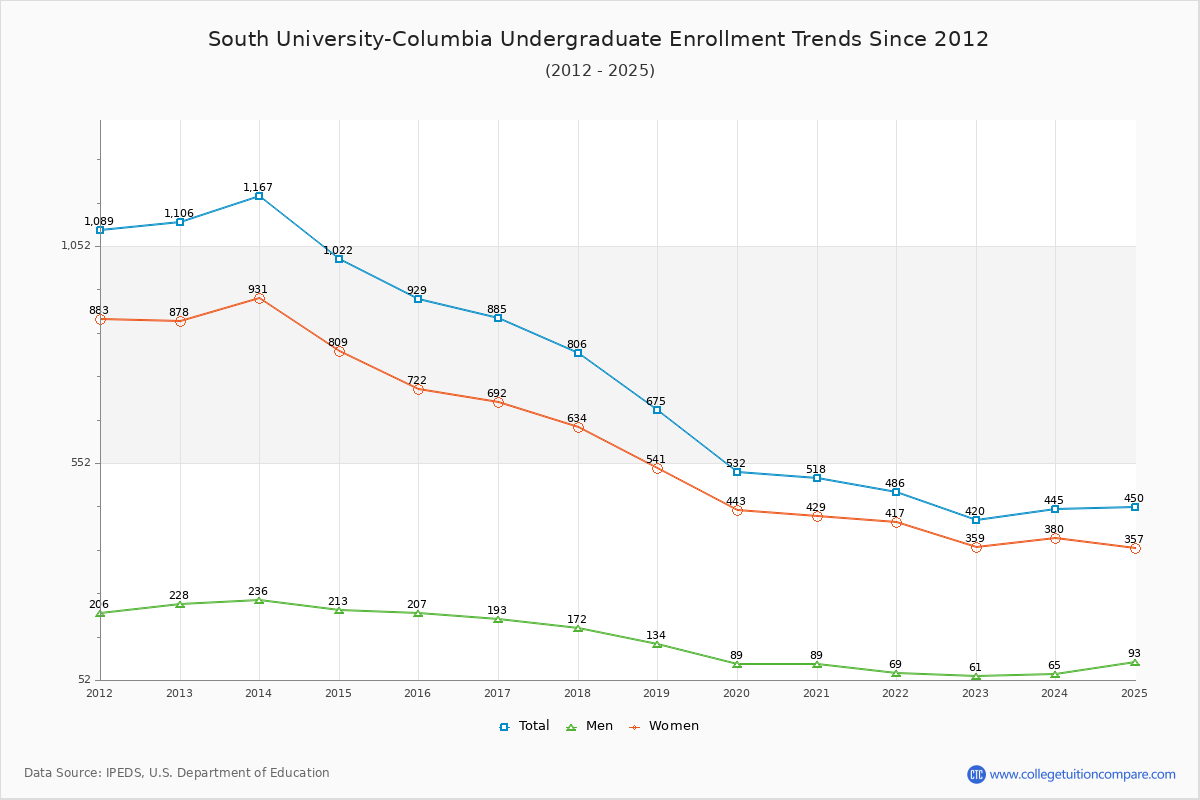
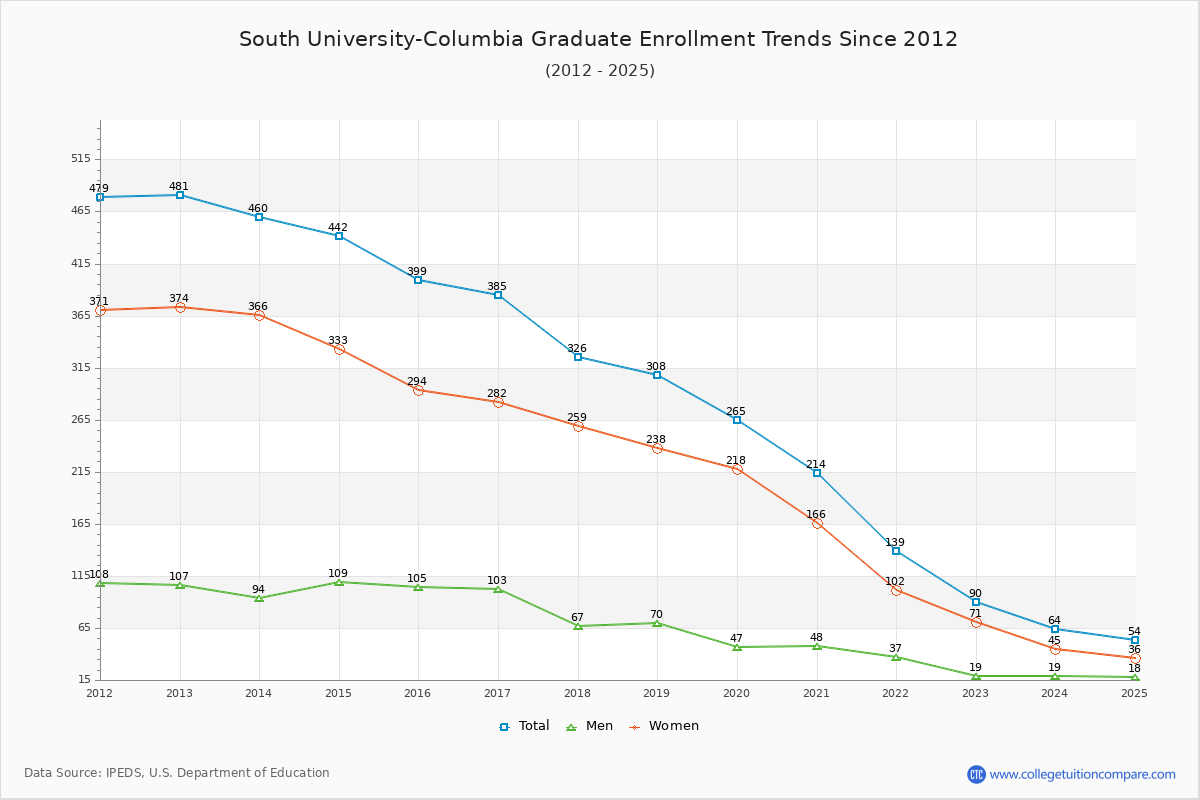
The percentage of undergraduate students at South University-Columbia is 89.29% which is decreased by 479 over last 10 years. The graduate student population decreased by 345 and it has been decreasing.

The female to male ratio is 3.54 to 1 which means that majority of population is on female students.

315 students enrolled in online degree program exclusively and the number of online students has decreased by -93.32% since 2015.

Student Population Changes

The average student population over the last 11 years is 839 where 504 students are attending the school for the academic year 2024-2025.

89.29% of total students is undergraduate students and 10.71% students is graduate students. The number of undergraduate students has decreased by 479 and the graduate enrollment has decreased by 345 over past 10 years.

The female to male ratio is 3.54 to 1 and it means that there are far more female students enrolled in South University-Columbia than male students.

The following table and chart illustrate the changes in student population by gender at South University-Columbia since 2015.

YearTotalUndergraduateGraduate
TotalMenWomenTotalMenWomen
2015-161,328929207722399105294
2016-171,270
-58
885
-44
193
-14
692
-30
385
-14
103
-2
282
-12
2017-181,132
-138
806
-79
172
-21
634
-58
326
-59
67
-36
259
-23
2018-19983
-149
675
-131
134
-38
541
-93
308
-18
70
3
238
-21
2019-20797
-186
532
-143
89
-45
443
-98
265
-43
47
-23
218
-20
2020-21732
-65
518
-14
89429
-14
214
-51
48
1
166
-52
2021-22625
-107
486
-32
69
-20
417
-12
139
-75
37
-11
102
-64
2022-23510
-115
420
-66
61
-8
359
-58
90
-49
19
-18
71
-31
2023-24509
-1
445
25
65
4
380
21
64
-26
1945
-26
2024-25504
-5
450
5
93
28
357
-23
54
-10
18
-1
36
-9
Average83961511749722453171
South University-Columbia Enrollment Trends Chart

Undergraduate Enrollment Changes

The average number of Undergraduate students over the last 11 years is 615 where 450 students are attending the Undergraduate school for the academic year 2024-2025. The following table and chart illustrate the changes in Undergraduate enrollment by attending status and gender at South University-Columbia since 2015.

YearTotalFull-timePart-time
TotalMenWomenTotalMenWomen
2015-1692960114245932865263
2016-1788550612737937966313
2017-1880655612543125047203
2018-1967549210239018332151
2019-205323835732614932117
2020-215183496028916929140
2021-224862944624819223169
2022-2342032247275981484
2023-244452914824315417137
2024-25450334762581161799
Average6156158333061534168
South University-Columbia Undergraduate Enrollment Trends Chart

Graduate Enrollment Changes

The average number of Graduate students over the last 11 years is 224 where 54 students are attending the Graduate school for the academic year 2024-2025. The following table and chart illustrate the changes in Graduate enrollment by attending status and gender at South University-Columbia since 2015.

YearTotalFull-timePart-time
TotalMenWomenTotalMenWomen
2015-16399119338628072208
2016-173851625310922350173
2017-183261353210319135156
2018-193081674012714130111
2019-20265141221191242599
2020-2121417037133441133
2021-22139942569451233
2022-239073175617215
2023-2464581840615
2024-2554491534532
Average22422429882242484
South University-Columbia Graduate Enrollment Trends Chart

Enrollment by Race/Ethnicity Changes

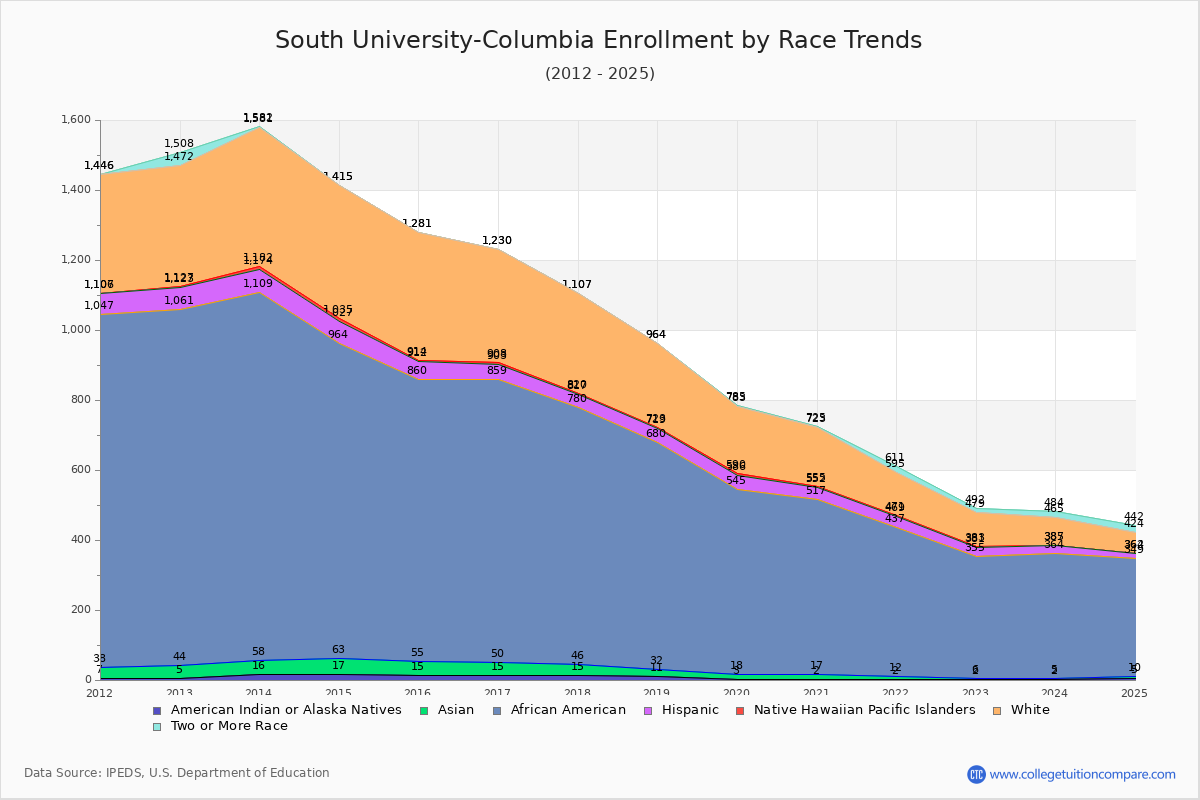
The percentage of white students is 11.90% and the percentage of black students is 67.26% at South University-Columbia. 0.99% of enrolled students is Asian. Hispanic students comprise 2.58% of the student body.

Over the past 10 years, the racial composition has shifted. The percentage of white students decreased from 27.64% to 11.90%. Asian enrollment declined from 3.01% to 0.99%. Black student enrollment increased from 60.62% to 67.26%. Hispanic student representation contracted from 3.92% to 2.58%.

The overall racial diversity, measured by the Census Bureau Diversity Index, is 0.5313 which indicates that somewhat diverse. This decreased from 0.5536 a decade ago, suggesting that racial diversity has declined.

The following table and chart illustrate the student population trends by race/ethnicity at South University-Columbia over the past 11 years (2015-2025).

YearAmerican Indian or Native AmericanAsianBlackHispanicNative Hawaiian or Other Pacific IslanderWhiteTwo or More Races
2015-1615408055223670
2016-1715358094453220
2017-1815317343732870
2018-1911216483942410
2019-203155274141932
2020-212155003531682
2021-2221042532212416
2022-23243492629613
2023-24233592127819
2024-25553391326018
Average7185503431947
South University-Columbia Enrollment by Race Trends Chart

Distance Learning (Online Courses) Enrollment Changes

315 students are enrolled in online degree programs exclusively for the academic year 2024-2025, which is 63% of total students. The number of online students has decreased -93.32% since 2015. The following table and chart illustrate the changes in the online student population by enrolled type at South University-Columbia from 2015 to 2025.

YearTotal EnrollmentOnline CompletelyEnrolled in Some Online CoursesNot Enrolled in Online Courses
2015-161,3280464864
2016-171,2700564706
2017-181,1320476656
2018-199830469514
2019-207970382415
2020-21732215124393
2021-22625165130330
2022-23510194107209
2023-2450926945195
2024-2550431531158
Average839116279444

Ratings & Review

Share your experiences and thoughts about South University-Columbia. It will be a great help to applicants and prospective students!