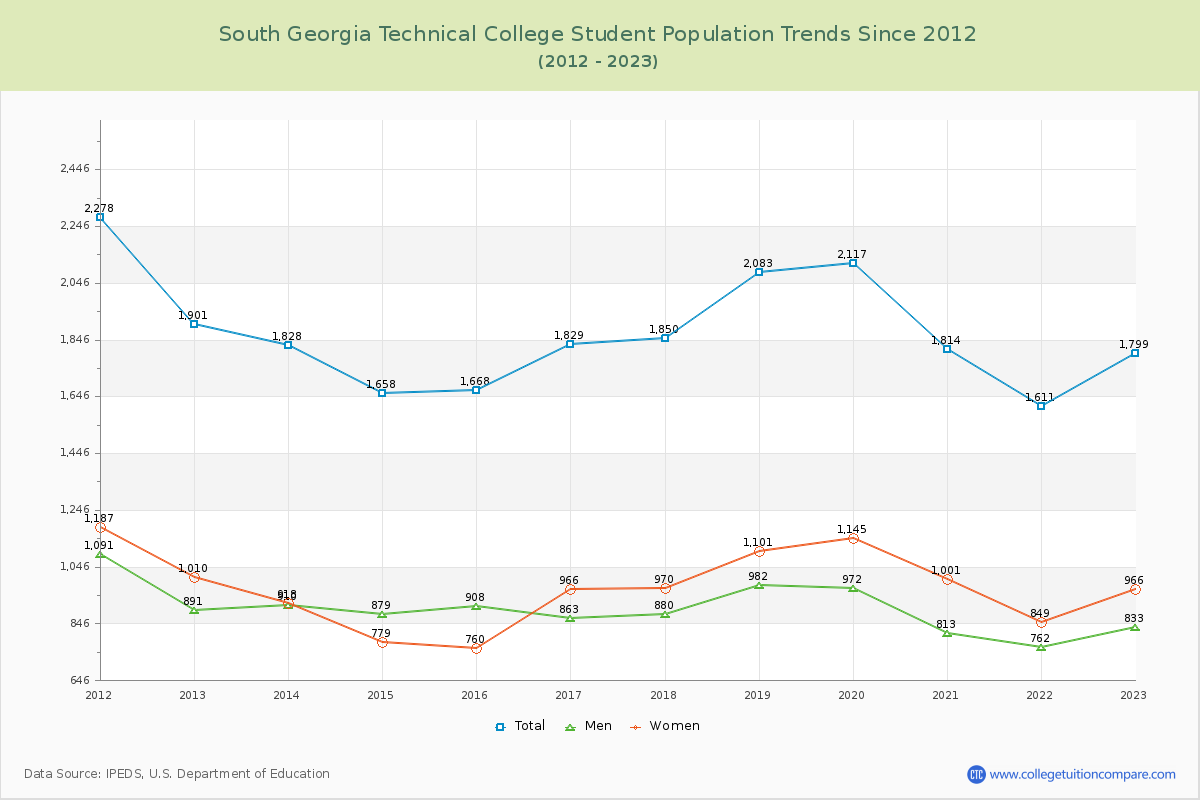
Student Population Changes
The average student population over the last 12 years is 1,833 where 1,799 students are attending the school for the academic year 2022-2023.
The female to male ratio is 1.16 to 1 and it means that there are slightly more female students enrolled in South Georgia Technical than male students.
The following table and chart illustrate the changes in student population by gender at South Georgia Technical College since 2012.
| Year | Total | Men | Women |
|---|---|---|---|
| 2012-13 | 1,901 | 891 | 1,010 |
| 2013-14 | 1,828 -73 | 910 19 | 918 -92 |
| 2014-15 | 1,658 -170 | 879 -31 | 779 -139 |
| 2015-16 | 1,668 10 | 908 29 | 760 -19 |
| 2016-17 | 1,829 161 | 863 -45 | 966 206 |
| 2017-18 | 1,850 21 | 880 17 | 970 4 |
| 2018-19 | 2,083 233 | 982 102 | 1,101 131 |
| 2019-20 | 2,117 34 | 972 -10 | 1,145 44 |
| 2020-21 | 1,814 -303 | 813 -159 | 1,001 -144 |
| 2021-22 | 1,611 -203 | 762 -51 | 849 -152 |
| 2022-23 | 1,799 188 | 833 71 | 966 117 |
| Average | 1,833 | 881 | 951 |