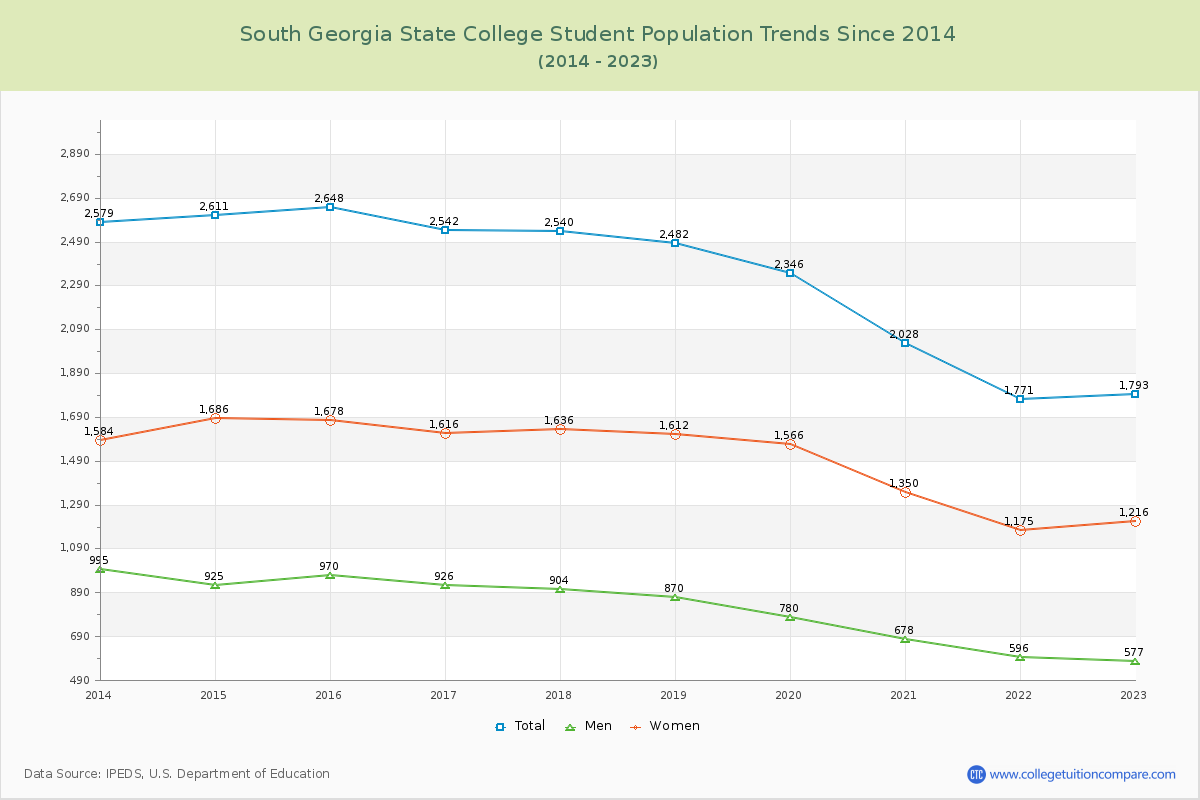
Student Population Changes
The average student population over the last 11 years is 2,334 where 1,793 students are attending the school for the academic year 2022-2023.
The female to male ratio is 2.11 to 1 and it means that there are far more female students enrolled in South Georgia State than male students.
The following table and chart illustrate the changes in student population by gender at South Georgia State College since 2013.
| Year | Total | Men | Women |
|---|---|---|---|
| 2013-14 | 2,579 | 995 | 1,584 |
| 2014-15 | 2,611 32 | 925 -70 | 1,686 102 |
| 2015-16 | 2,648 37 | 970 45 | 1,678 -8 |
| 2016-17 | 2,542 -106 | 926 -44 | 1,616 -62 |
| 2017-18 | 2,540 -2 | 904 -22 | 1,636 20 |
| 2018-19 | 2,482 -58 | 870 -34 | 1,612 -24 |
| 2019-20 | 2,346 -136 | 780 -90 | 1,566 -46 |
| 2020-21 | 2,028 -318 | 678 -102 | 1,350 -216 |
| 2021-22 | 1,771 -257 | 596 -82 | 1,175 -175 |
| 2022-23 | 1,793 22 | 577 -19 | 1,216 41 |
| Average | 2,334 | 822 | 1,512 |