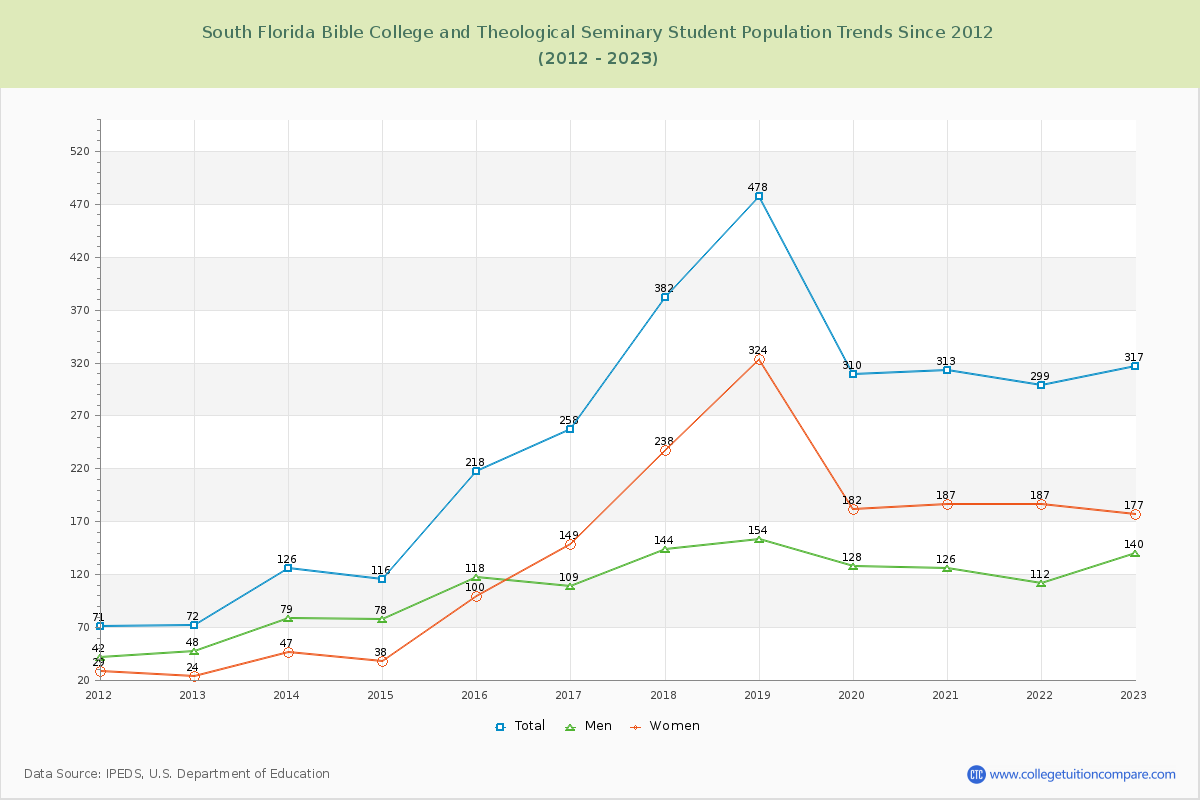
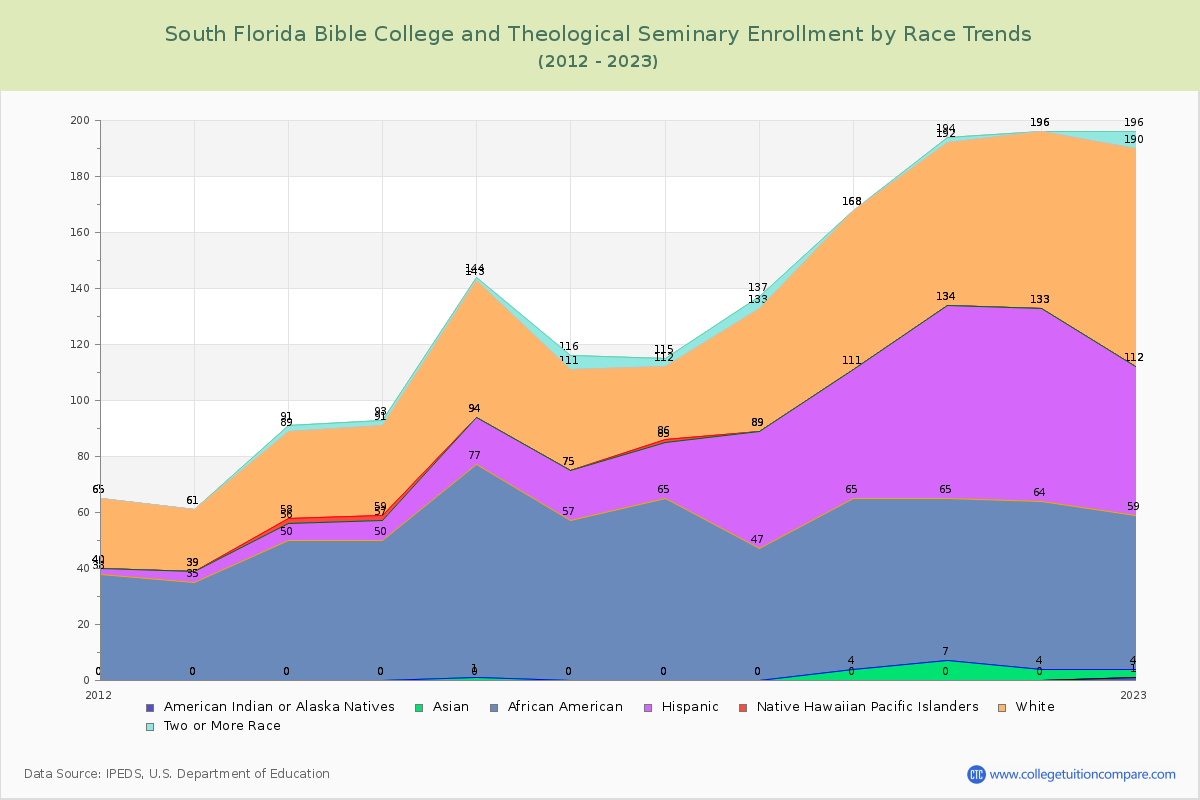
Student Population Changes
The average student population over the last 12 years is 263 where 317 students are attending the school for the academic year 2022-2023.
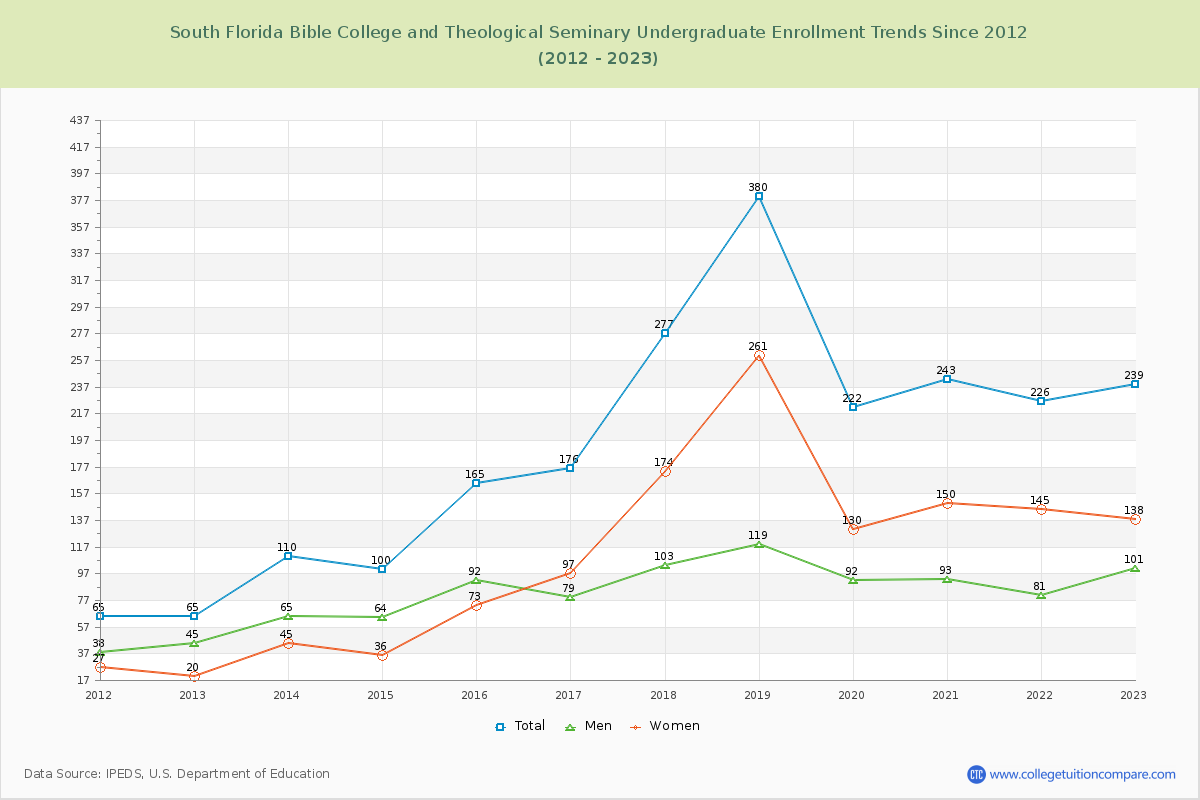
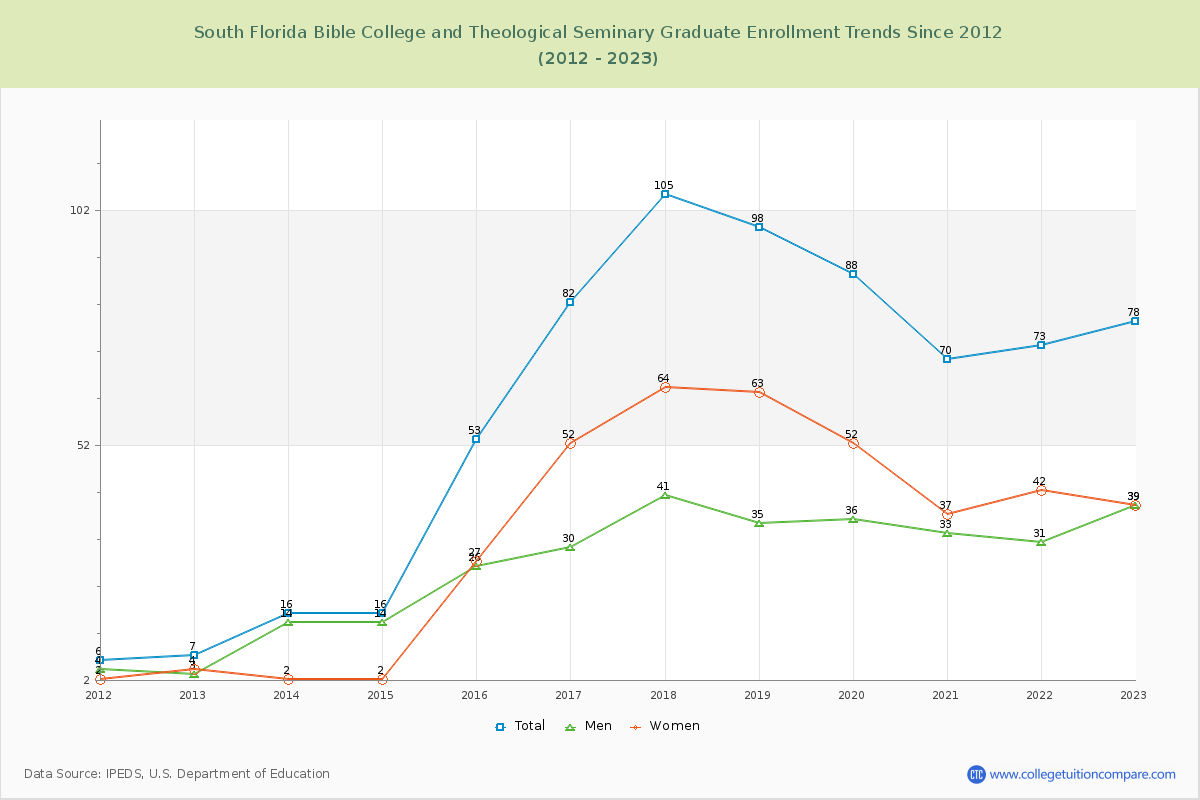
75.39% of total students is undergraduate students and 24.61% students is graduate students. The number of undergraduate students has increased by 174 and the graduate enrollment has increased by 71 over past 10 years.
The female to male ratio is 1.26 to 1 and it means that there are slightly more female students enrolled in South Florida Bible College and Theological Seminary than male students.
The following table and chart illustrate the changes in student population by gender at South Florida Bible College and Theological Seminary since 2012.
| Year | Total | Undergraduate | Graduate | ||||
|---|---|---|---|---|---|---|---|
| Total | Men | Women | Total | Men | Women | ||
| 2012-13 | 72 | 65 | 45 | 20 | 7 | 3 | 4 |
| 2013-14 | 126 54 | 110 45 | 65 20 | 45 25 | 16 9 | 14 11 | 2 -2 |
| 2014-15 | 116 -10 | 100 -10 | 64 -1 | 36 -9 | 16 0 | 14 0 | 2 0 |
| 2015-16 | 218 102 | 165 65 | 92 28 | 73 37 | 53 37 | 26 12 | 27 25 |
| 2016-17 | 258 40 | 176 11 | 79 -13 | 97 24 | 82 29 | 30 4 | 52 25 |
| 2017-18 | 382 124 | 277 101 | 103 24 | 174 77 | 105 23 | 41 11 | 64 12 |
| 2018-19 | 478 96 | 380 103 | 119 16 | 261 87 | 98 -7 | 35 -6 | 63 -1 |
| 2019-20 | 310 -168 | 222 -158 | 92 -27 | 130 -131 | 88 -10 | 36 1 | 52 -11 |
| 2020-21 | 313 3 | 243 21 | 93 1 | 150 20 | 70 -18 | 33 -3 | 37 -15 |
| 2021-22 | 299 -14 | 226 -17 | 81 -12 | 145 -5 | 73 3 | 31 -2 | 42 5 |
| 2022-23 | 317 18 | 239 13 | 101 20 | 138 -7 | 78 5 | 39 8 | 39 -3 |
| Average | 263 | 200 | 85 | 115 | 62 | 27 | 35 |