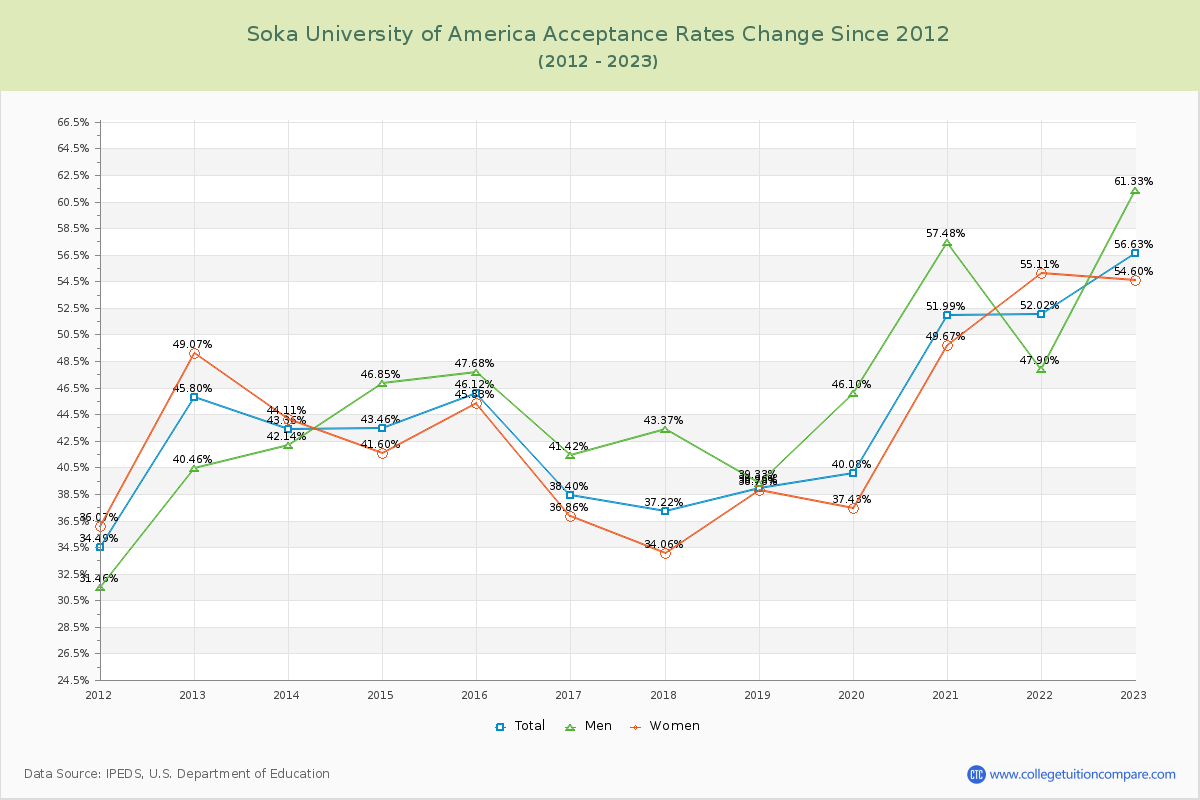
Acceptance Rate Changes
The average acceptance rate over the last 10 years is 44.91%, and this year's acceptance rate is 56.63% at Soka University of America. By gender, men students' acceptance rate is 46.73% and women students' rate is 44.24%.
The next table and chart illustrate the acceptance rates changes at Soka University of America over the past 11 years (2012-2023).
| Year | Total | Men | Women |
|---|---|---|---|
| 2012-13 | 45.80% | 40.46% | 49.07% |
| 2013-14 | 43.36% -2.43% |
42.14% -4.96% |
44.11% -4.96% |
| 2014-15 | 43.46% 0.09% |
46.85% -2.50% |
41.60% -2.50% |
| 2015-16 | 46.12% 2.66% |
47.68% 3.73% |
45.33% 3.73% |
| 2016-17 | 38.40% -7.72% |
41.42% -8.48% |
36.86% -8.48% |
| 2017-18 | 37.22% -1.18% |
43.37% -2.80% |
34.06% -2.80% |
| 2018-19 | 38.96% 1.74% |
39.33% 4.73% |
38.78% 4.73% |
| 2019-20 | 40.08% 1.12% |
46.10% -1.35% |
37.43% -1.35% |
| 2020-21 | 51.99% 11.91% |
57.48% 12.24% |
49.67% 12.24% |
| 2021-22 | 52.02% 0.03% |
47.90% 5.45% |
55.11% 5.45% |
| 2022-23 | 56.63% 4.60% |
61.33% -0.52% |
54.60% -0.52% |
| Average | 44.91% | 46.73% | 44.24% |