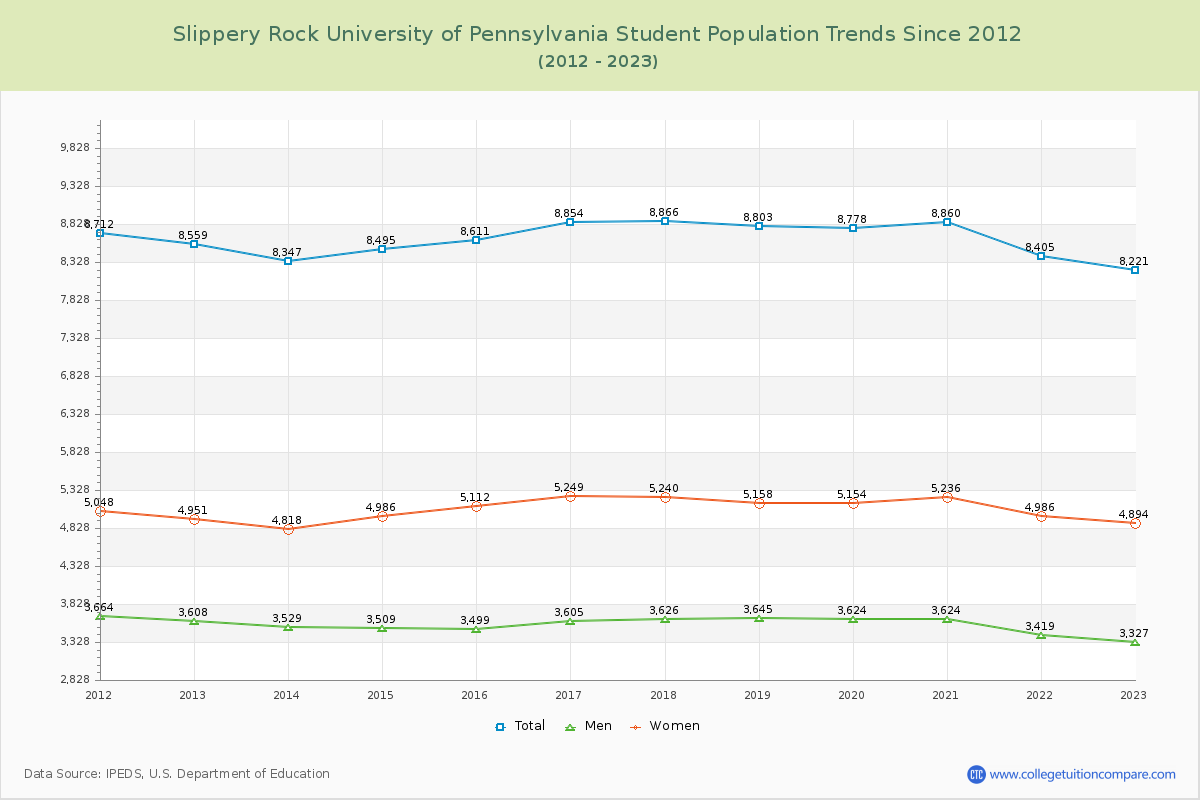
Student Population Changes
The average student population over the last 12 years is 8,618 where 8,221 students are attending the school for the academic year 2022-2023.
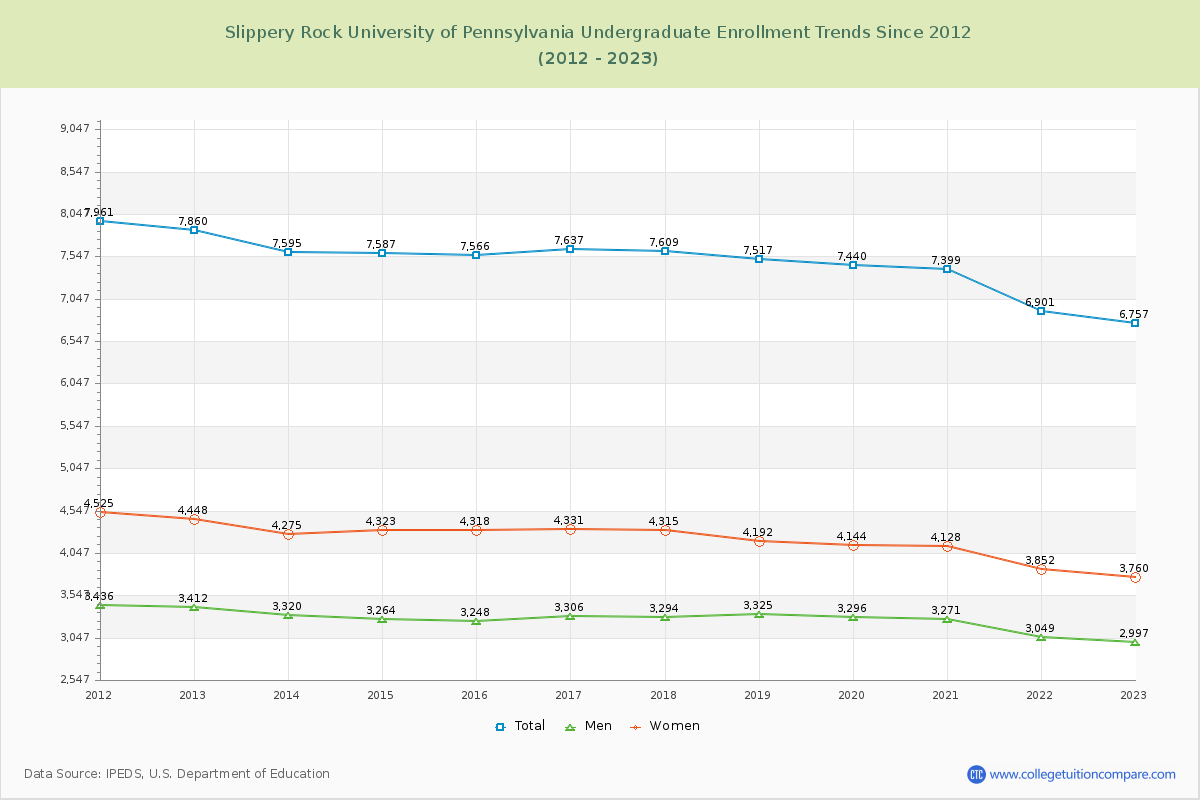
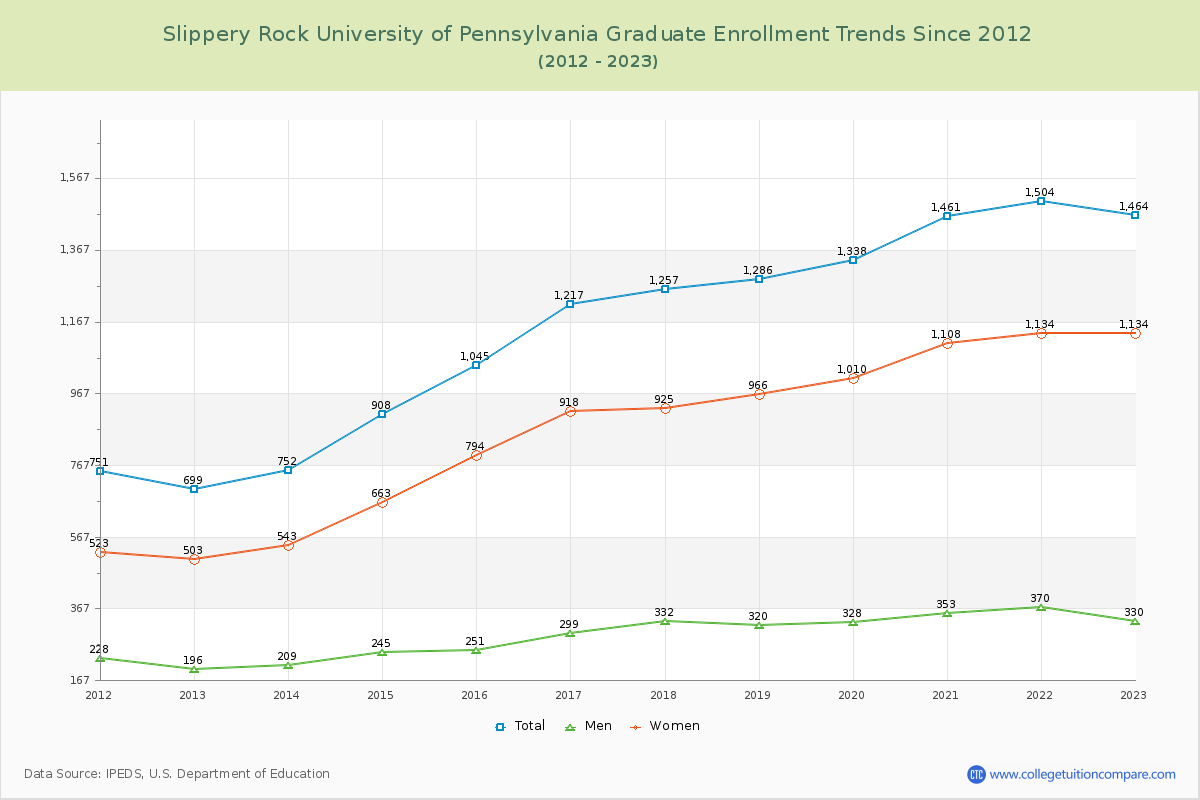
82.19% of total students is undergraduate students and 17.81% students is graduate students. The number of undergraduate students has decreased by 1,103 and the graduate enrollment has increased by 765 over past 10 years.
The female to male ratio is 1.47 to 1 and it means that there are more female students enrolled in Slippery Rock University of Pennsylvania than male students.
The following table and chart illustrate the changes in student population by gender at Slippery Rock University of Pennsylvania since 2012.
| Year | Total | Undergraduate | Graduate | ||||
|---|---|---|---|---|---|---|---|
| Total | Men | Women | Total | Men | Women | ||
| 2012-13 | 8,559 | 7,860 | 3,412 | 4,448 | 699 | 196 | 503 |
| 2013-14 | 8,347 -212 | 7,595 -265 | 3,320 -92 | 4,275 -173 | 752 53 | 209 13 | 543 40 |
| 2014-15 | 8,495 148 | 7,587 -8 | 3,264 -56 | 4,323 48 | 908 156 | 245 36 | 663 120 |
| 2015-16 | 8,611 116 | 7,566 -21 | 3,248 -16 | 4,318 -5 | 1,045 137 | 251 6 | 794 131 |
| 2016-17 | 8,854 243 | 7,637 71 | 3,306 58 | 4,331 13 | 1,217 172 | 299 48 | 918 124 |
| 2017-18 | 8,866 12 | 7,609 -28 | 3,294 -12 | 4,315 -16 | 1,257 40 | 332 33 | 925 7 |
| 2018-19 | 8,803 -63 | 7,517 -92 | 3,325 31 | 4,192 -123 | 1,286 29 | 320 -12 | 966 41 |
| 2019-20 | 8,778 -25 | 7,440 -77 | 3,296 -29 | 4,144 -48 | 1,338 52 | 328 8 | 1,010 44 |
| 2020-21 | 8,860 82 | 7,399 -41 | 3,271 -25 | 4,128 -16 | 1,461 123 | 353 25 | 1,108 98 |
| 2021-22 | 8,405 -455 | 6,901 -498 | 3,049 -222 | 3,852 -276 | 1,504 43 | 370 17 | 1,134 26 |
| 2022-23 | 8,221 -184 | 6,757 -144 | 2,997 -52 | 3,760 -92 | 1,464 -40 | 330 -40 | 1,134 0 |
| Average | 8,618 | 7,443 | 3,253 | 4,190 | 1,176 | 294 | 882 |