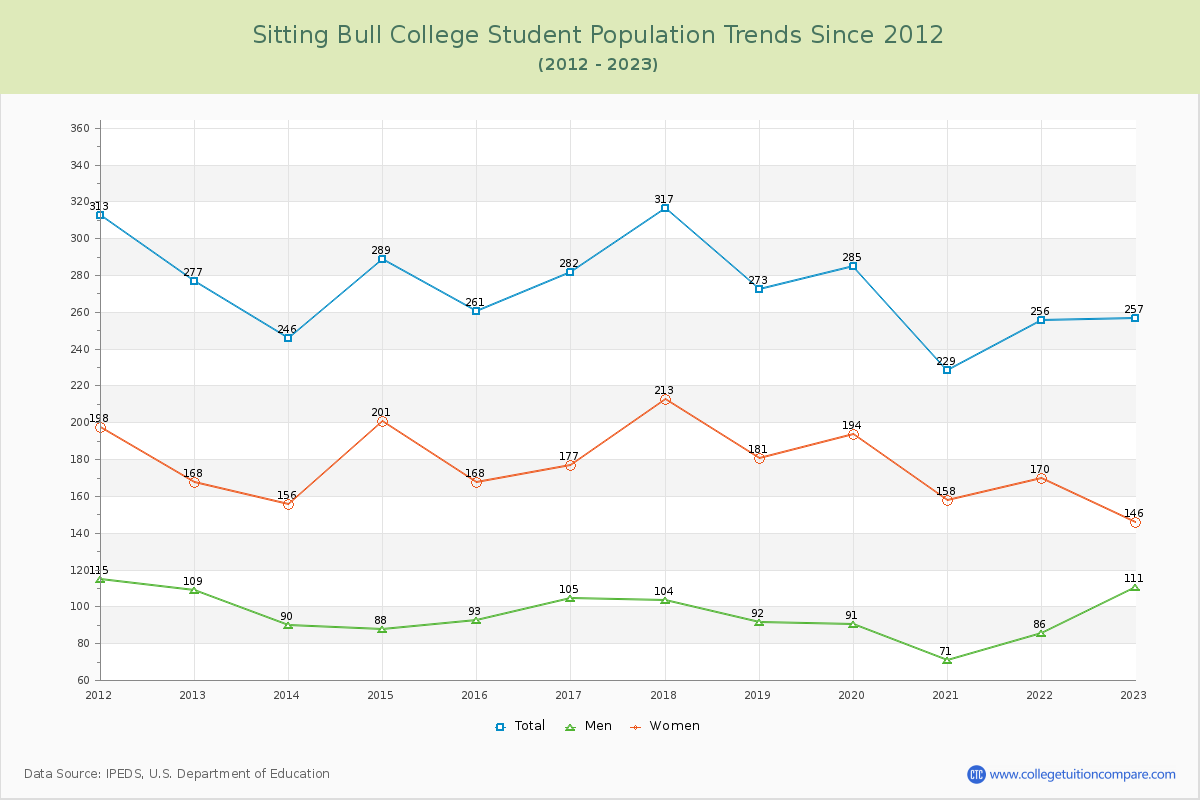
Student Population Changes
The average student population over the last 12 years is 270 where 257 students are attending the school for the academic year 2022-2023.
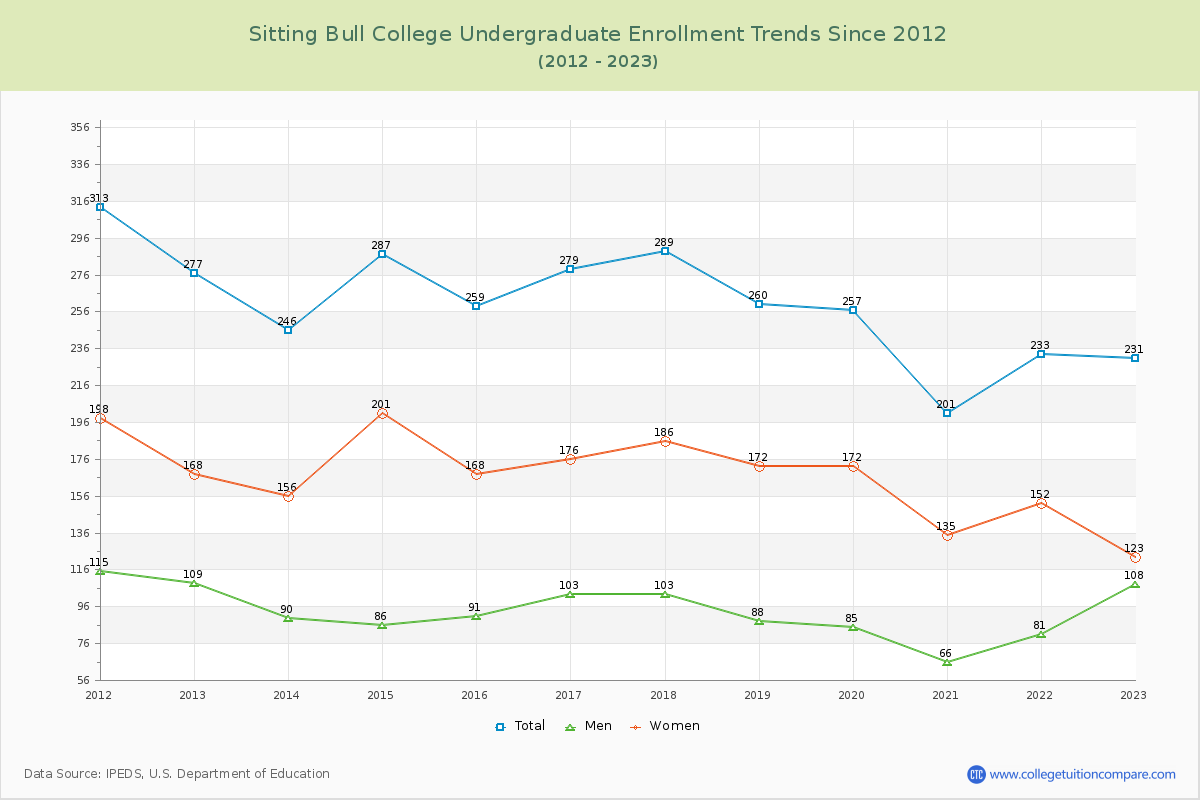
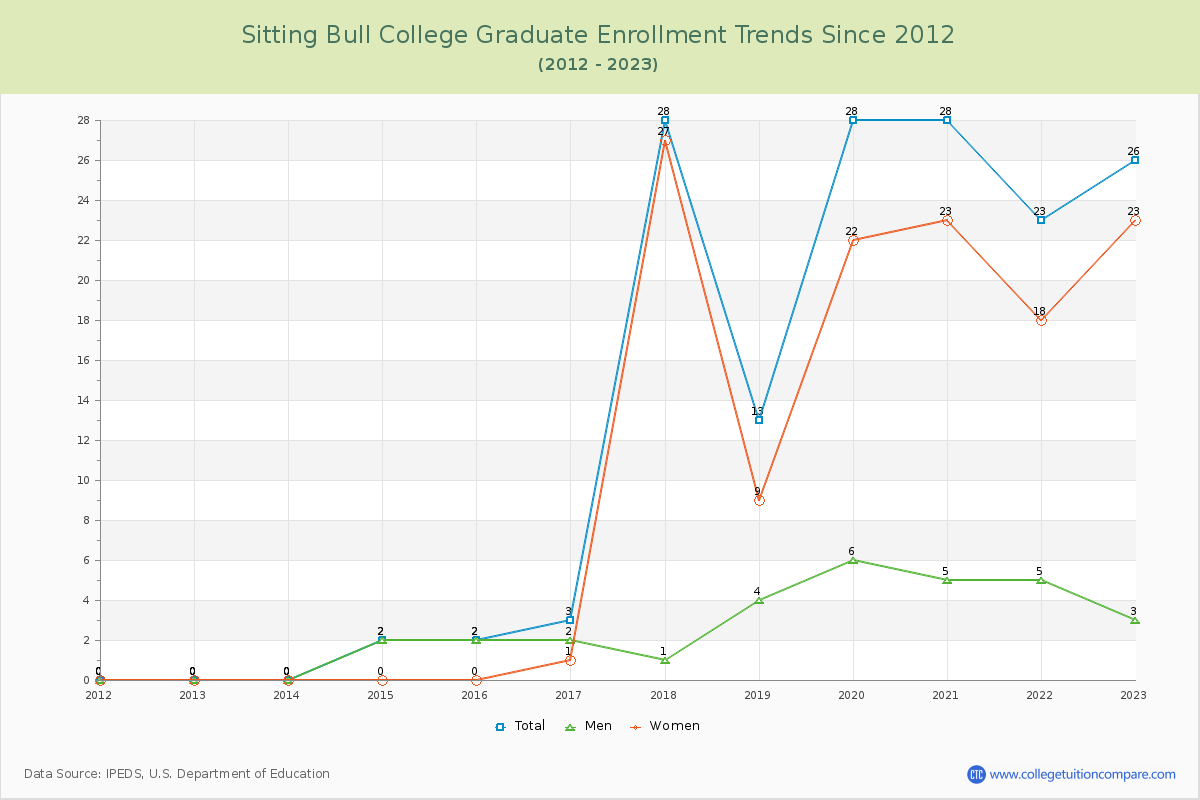
89.88% of total students is undergraduate students and 10.12% students is graduate students. The number of undergraduate students has decreased by 46 and the graduate enrollment has increased by 26 over past 10 years.
The female to male ratio is 1.32 to 1 and it means that there are more female students enrolled in Sitting Bull than male students.
The following table and chart illustrate the changes in student population by gender at Sitting Bull College since 2012.
| Year | Total | Undergraduate | Graduate | ||||
|---|---|---|---|---|---|---|---|
| Total | Men | Women | Total | Men | Women | ||
| 2012-13 | 277 | 277 | 109 | 168 | 0 | 0 | 0 |
| 2013-14 | 246 -31 | 246 -31 | 90 -19 | 156 -12 | 0 0 | 0 0 | 0 0 |
| 2014-15 | 289 43 | 287 41 | 86 -4 | 201 45 | 2 2 | 2 2 | 0 0 |
| 2015-16 | 261 -28 | 259 -28 | 91 5 | 168 -33 | 2 0 | 2 0 | 0 0 |
| 2016-17 | 282 21 | 279 20 | 103 12 | 176 8 | 3 1 | 2 0 | 1 1 |
| 2017-18 | 317 35 | 289 10 | 103 0 | 186 10 | 28 25 | 1 -1 | 27 26 |
| 2018-19 | 273 -44 | 260 -29 | 88 -15 | 172 -14 | 13 -15 | 4 3 | 9 -18 |
| 2019-20 | 285 12 | 257 -3 | 85 -3 | 172 0 | 28 15 | 6 2 | 22 13 |
| 2020-21 | 229 -56 | 201 -56 | 66 -19 | 135 -37 | 28 0 | 5 -1 | 23 1 |
| 2021-22 | 256 27 | 233 32 | 81 15 | 152 17 | 23 -5 | 5 0 | 18 -5 |
| 2022-23 | 257 1 | 231 -2 | 108 27 | 123 -29 | 26 3 | 3 -2 | 23 5 |
| Average | 270 | 256 | 92 | 164 | 14 | 3 | 11 |