Enrollment Trends at Siena Heights

-926

Total Enrollment

-313

Men

-613

Women

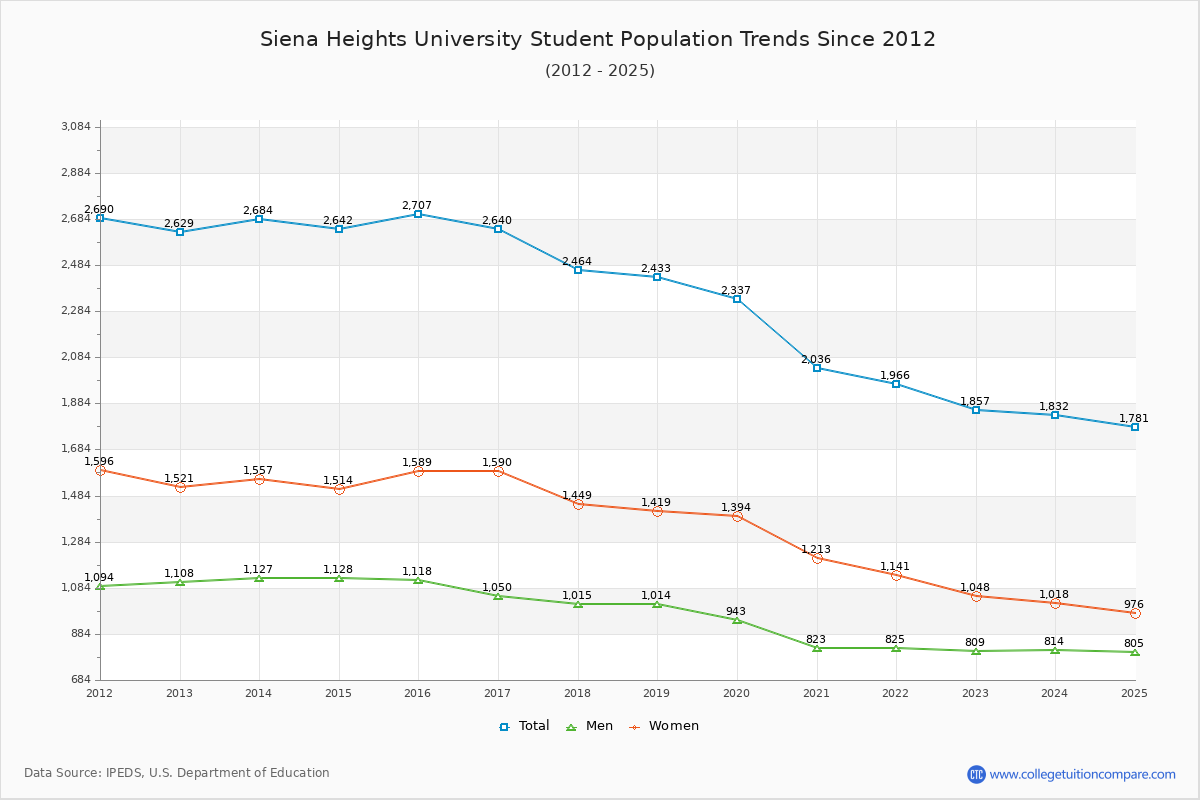
The student population at Siena Heights University is 1,781 (1,628 undergraduate and 153 graduate students) . The number of students has decreased by 926 over the past decade.

The percentage of undergraduate students at Siena Heights is 91.41% which is decreased by 864 over last 10 years. The graduate student population decreased by 62 and it has been decreasing.

The female to male ratio is 1.21 to 1 which means that female students enrolled slightly more than male students.

686 students enrolled in online degree program exclusively and the number of online students has decreased by -12.16% since 2015.

Student Population Changes

The average student population over the last 11 years is 2,205 where 1,781 students are attending the school for the academic year 2024-2025.

91.41% of total students is undergraduate students and 8.59% students is graduate students. The number of undergraduate students has decreased by 864 and the graduate enrollment has decreased by 62 over past 10 years.

The female to male ratio is 1.21 to 1 and it means that there are slightly more female students enrolled in Siena Heights than male students.

The following table and chart illustrate the changes in student population by gender at Siena Heights University since 2015.

YearTotalUndergraduateGraduate
TotalMenWomenTotalMenWomen
2015-162,7072,4921,0551,43721563152
2016-172,640
-67
2,407
-85
992
-63
1,415
-22
233
18
58
-5
175
23
2017-182,464
-176
2,302
-105
970
-22
1,332
-83
162
-71
45
-13
117
-58
2018-192,433
-31
2,216
-86
943
-27
1,273
-59
217
55
71
26
146
29
2019-202,337
-96
2,103
-113
861
-82
1,242
-31
234
17
82
11
152
6
2020-212,036
-301
1,841
-262
751
-110
1,090
-152
195
-39
72
-10
123
-29
2021-221,966
-70
1,782
-59
757
6
1,025
-65
184
-11
68
-4
116
-7
2022-231,857
-109
1,702
-80
754
-3
948
-77
155
-29
55
-13
100
-16
2023-241,832
-25
1,669
-33
752
-2
917
-31
163
8
62
7
101
1
2024-251,781
-51
1,628
-41
744
-8
884
-33
153
-10
61
-1
92
-9
Average2,2052,0148581,15619164127
Siena Heights University Enrollment Trends Chart

Undergraduate Enrollment Changes

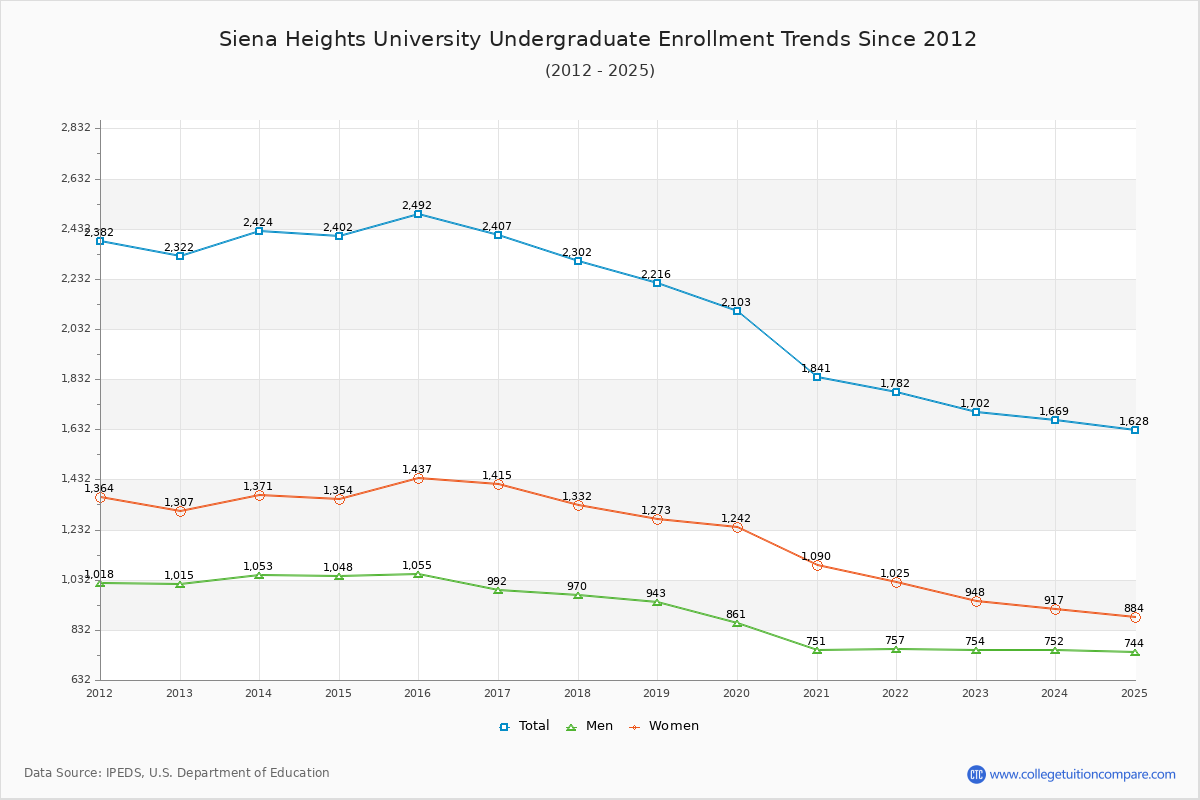
The average number of Undergraduate students over the last 11 years is 2,014 where 1,628 students are attending the Undergraduate school for the academic year 2024-2025. The following table and chart illustrate the changes in Undergraduate enrollment by attending status and gender at Siena Heights University since 2015.

YearTotalFull-timePart-time
TotalMenWomenTotalMenWomen
2015-162,4921,3106126981,182443739
2016-172,4071,3276047231,080388692
2017-182,3021,2905877031,012383629
2018-192,2161,246588658970355615
2019-202,1031,257588669846273573
2020-211,8411,123507616718244474
2021-221,7821,116542574666215451
2022-231,7021,103532571599222377
2023-241,6691,086533553583219364
2024-251,6281,129540589499204295
Average2,0142,0145636352,014295521
Siena Heights University Undergraduate Enrollment Trends Chart

Graduate Enrollment Changes

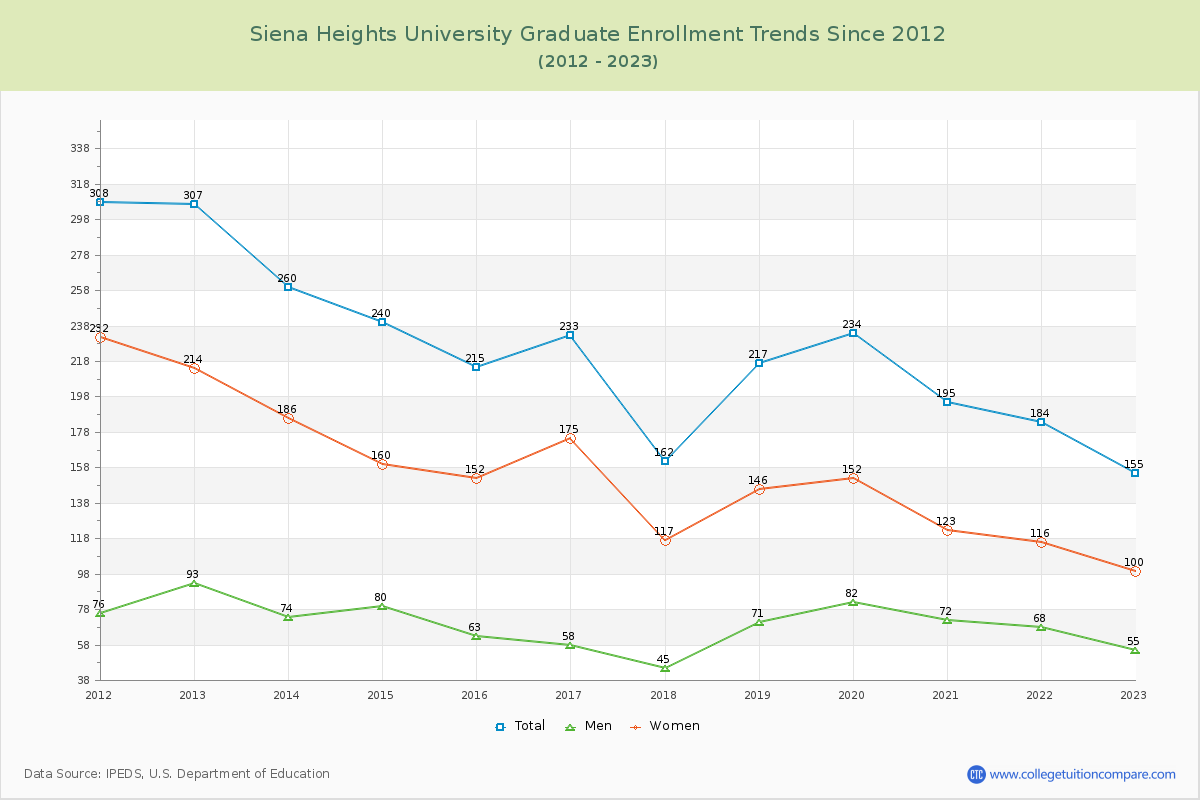
The average number of Graduate students over the last 11 years is 191 where 153 students are attending the Graduate school for the academic year 2024-2025. The following table and chart illustrate the changes in Graduate enrollment by attending status and gender at Siena Heights University since 2015.

YearTotalFull-timePart-time
TotalMenWomenTotalMenWomen
2015-1621563320960149
2016-1723384216314937112
2017-18162298211333796
2018-1921734142018357126
2019-2023460263417456118
2020-211956728391284484
2021-221845718391275077
2022-231554712351084365
2023-241635928311043470
2024-251535220321014160
Average19119118321914696
Siena Heights University Graduate Enrollment Trends Chart

Enrollment by Race/Ethnicity Changes

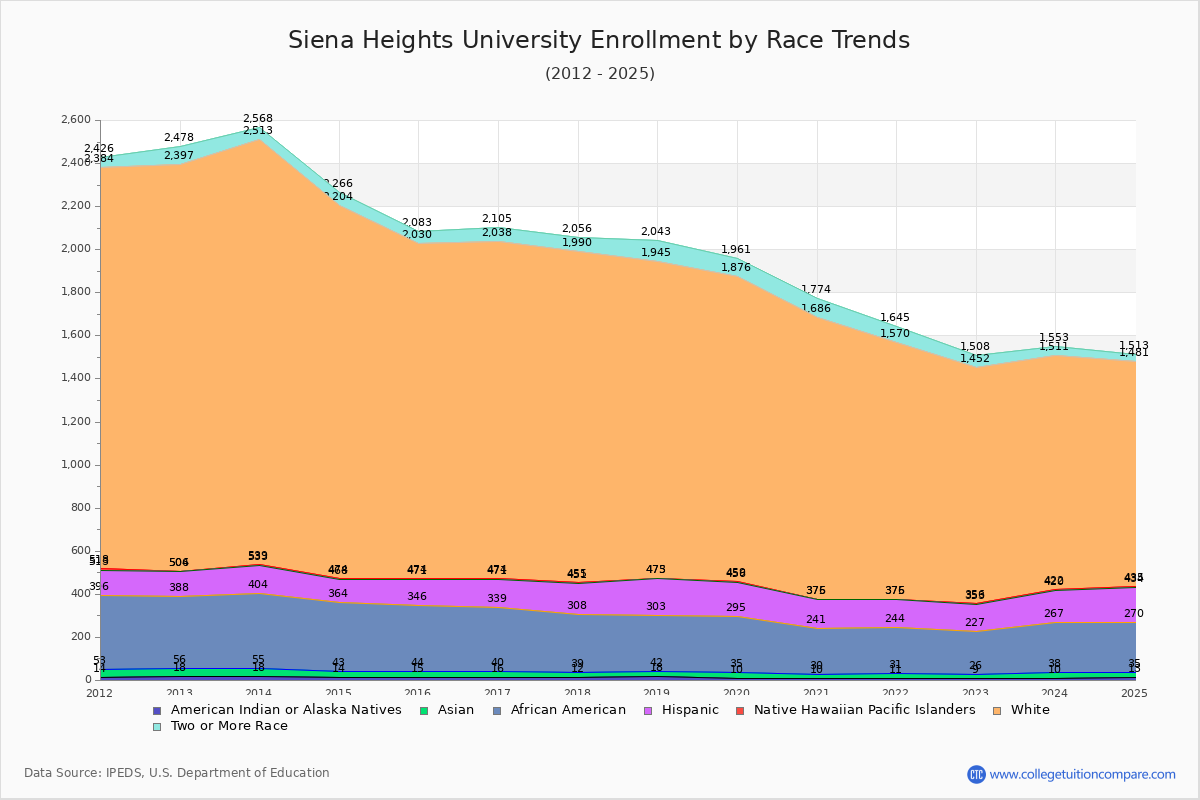
The percentage of white students is 58.73%. The percentage was 57.48% 10 years ago and Siena Heights still has a high percentage of white students. 1.24% of enrolled students is Asian and 13.19% is black students. Hispanic students comprise 9.21% of the student body.

Over the past 10 years, the racial composition has shifted. The percentage of white students increased from 57.48% to 58.73%. Asian enrollment grew from 1.07% to 1.24%. Black student enrollment increased from 11.16% to 13.19%. Hispanic student representation expanded from 4.62% to 9.21%.

The overall racial diversity, measured by the Census Bureau Diversity Index, is 0.6286 which indicates that moderately diverse. This decreased from 0.6545 a decade ago, suggesting that racial diversity has declined.

The following table and chart illustrate the student population trends by race/ethnicity at Siena Heights University over the past 11 years (2015-2025).

YearAmerican Indian or Native AmericanAsianBlackHispanicNative Hawaiian or Other Pacific IslanderWhiteTwo or More Races
2015-16152930212531,55653
2016-17162429913231,56467
2017-18122726914341,53566
2018-19182426117021,47098
2019-20102526016131,41785
2020-21102021113411,31088
2021-22112021313111,19475
2022-2391720112631,09656
2023-24102822915321,08942
2024-25132223516411,04632
Average122424814421,32866
Siena Heights University Enrollment by Race Trends Chart

Distance Learning (Online Courses) Enrollment Changes

686 students are enrolled in online degree programs exclusively for the academic year 2024-2025, which is 39% of total students. The number of online students has decreased -12.16% since 2015. The following table and chart illustrate the changes in the online student population by enrolled type at Siena Heights University from 2015 to 2025.

YearTotal EnrollmentOnline CompletelyEnrolled in Some Online CoursesNot Enrolled in Online Courses
2015-162,7077814721,454
2016-172,6408243751,441
2017-182,4647823101,372
2018-192,4335426341,257
2019-202,3375551771,605
2020-212,073751501821
2021-221,966734506726
2022-231,857641563653
2023-241,832777748307
2024-251,781686839256
Average2,209707513989

Ratings & Review

Share your experiences and thoughts about Siena Heights University. It will be a great help to applicants and prospective students!