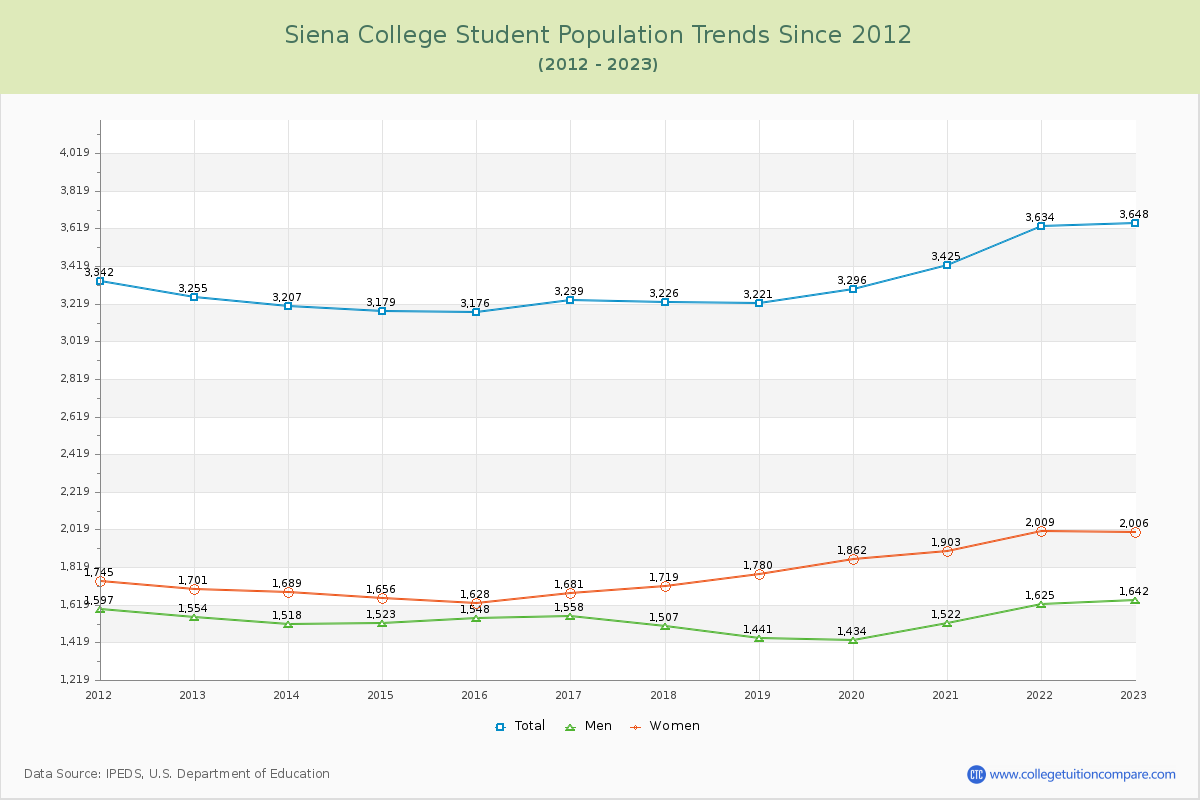
Student Population Changes
The average student population over the last 12 years is 3,319 where 3,648 students are attending the school for the academic year 2022-2023.
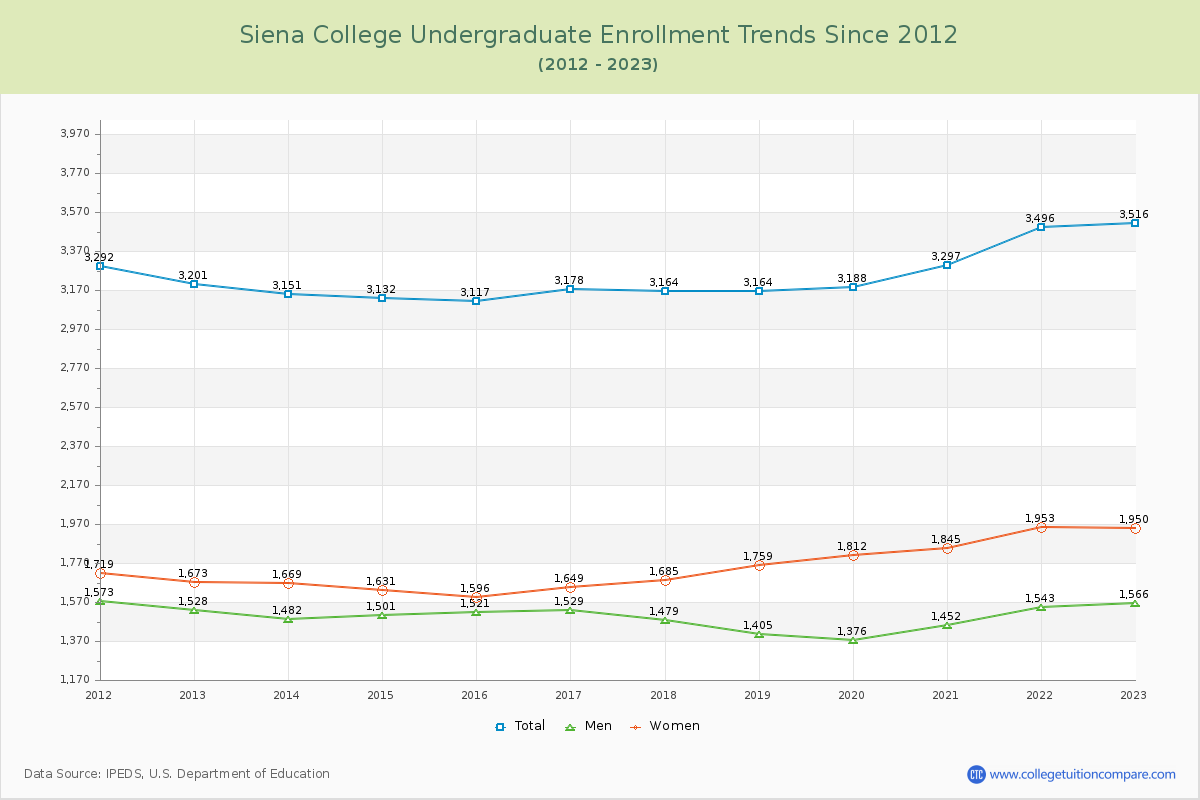
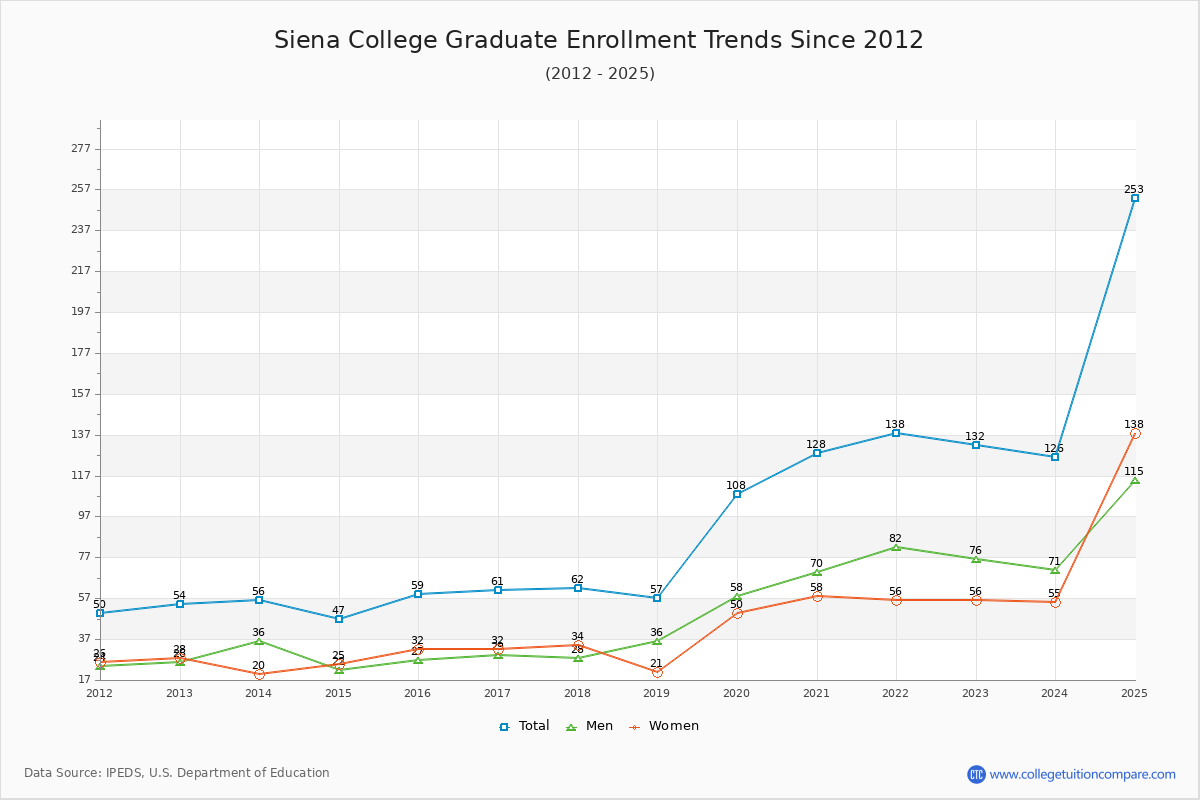
96.38% of total students is undergraduate students and 3.62% students is graduate students. The number of undergraduate students has increased by 315 and the graduate enrollment has increased by 78 over past 10 years.
The female to male ratio is 1.22 to 1 and it means that there are slightly more female students enrolled in Siena than male students.
The following table and chart illustrate the changes in student population by gender at Siena College since 2012.
| Year | Total | Undergraduate | Graduate | ||||
|---|---|---|---|---|---|---|---|
| Total | Men | Women | Total | Men | Women | ||
| 2012-13 | 3,255 | 3,201 | 1,528 | 1,673 | 54 | 26 | 28 |
| 2013-14 | 3,207 -48 | 3,151 -50 | 1,482 -46 | 1,669 -4 | 56 2 | 36 10 | 20 -8 |
| 2014-15 | 3,179 -28 | 3,132 -19 | 1,501 19 | 1,631 -38 | 47 -9 | 22 -14 | 25 5 |
| 2015-16 | 3,176 -3 | 3,117 -15 | 1,521 20 | 1,596 -35 | 59 12 | 27 5 | 32 7 |
| 2016-17 | 3,239 63 | 3,178 61 | 1,529 8 | 1,649 53 | 61 2 | 29 2 | 32 0 |
| 2017-18 | 3,226 -13 | 3,164 -14 | 1,479 -50 | 1,685 36 | 62 1 | 28 -1 | 34 2 |
| 2018-19 | 3,221 -5 | 3,164 0 | 1,405 -74 | 1,759 74 | 57 -5 | 36 8 | 21 -13 |
| 2019-20 | 3,296 75 | 3,188 24 | 1,376 -29 | 1,812 53 | 108 51 | 58 22 | 50 29 |
| 2020-21 | 3,425 129 | 3,297 109 | 1,452 76 | 1,845 33 | 128 20 | 70 12 | 58 8 |
| 2021-22 | 3,634 209 | 3,496 199 | 1,543 91 | 1,953 108 | 138 10 | 82 12 | 56 -2 |
| 2022-23 | 3,648 14 | 3,516 20 | 1,566 23 | 1,950 -3 | 132 -6 | 76 -6 | 56 0 |
| Average | 3,319 | 3,237 | 1,489 | 1,747 | 82 | 45 | 37 |