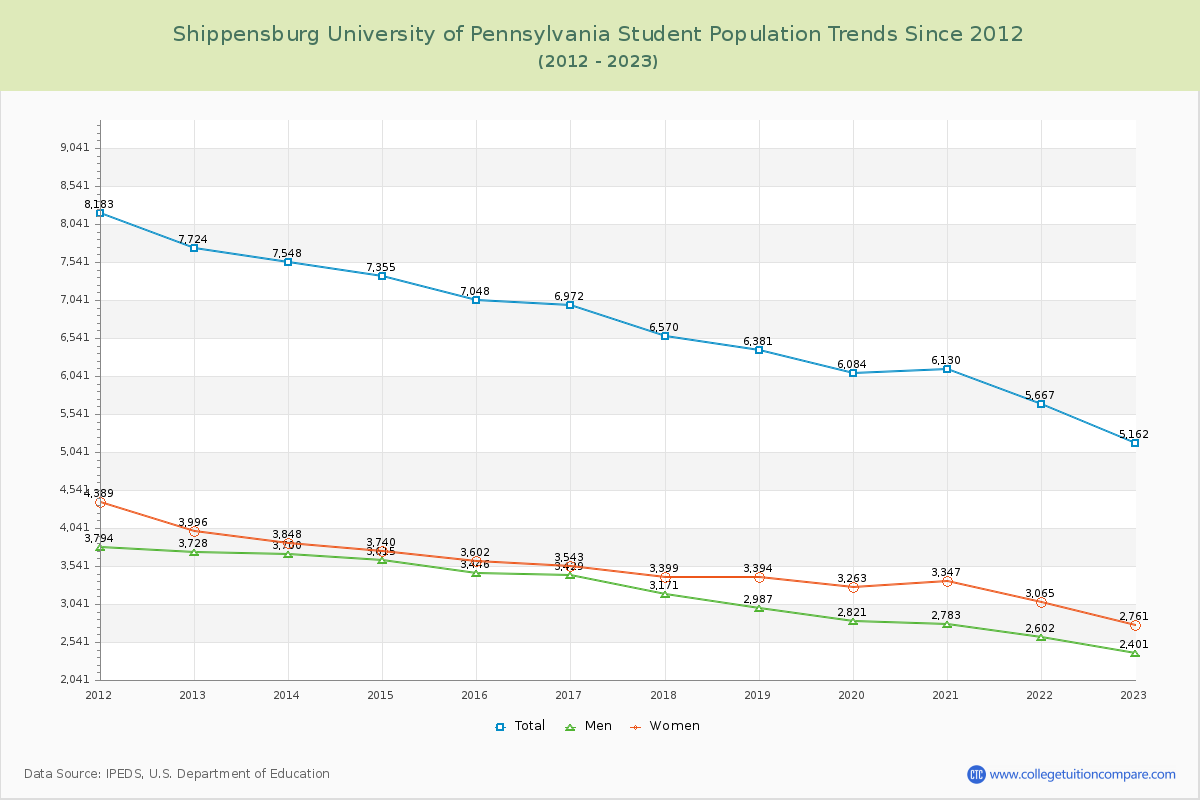
Student Population Changes
The average student population over the last 12 years is 6,604 where 5,162 students are attending the school for the academic year 2022-2023.
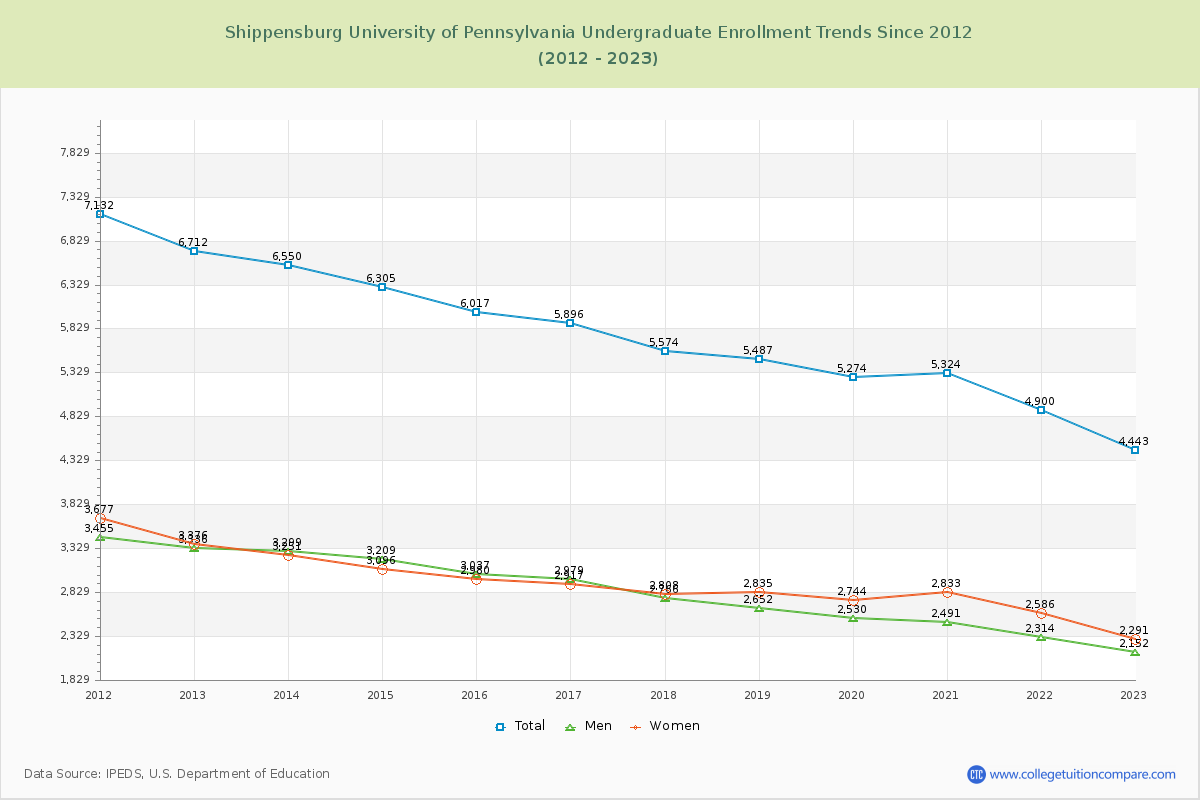
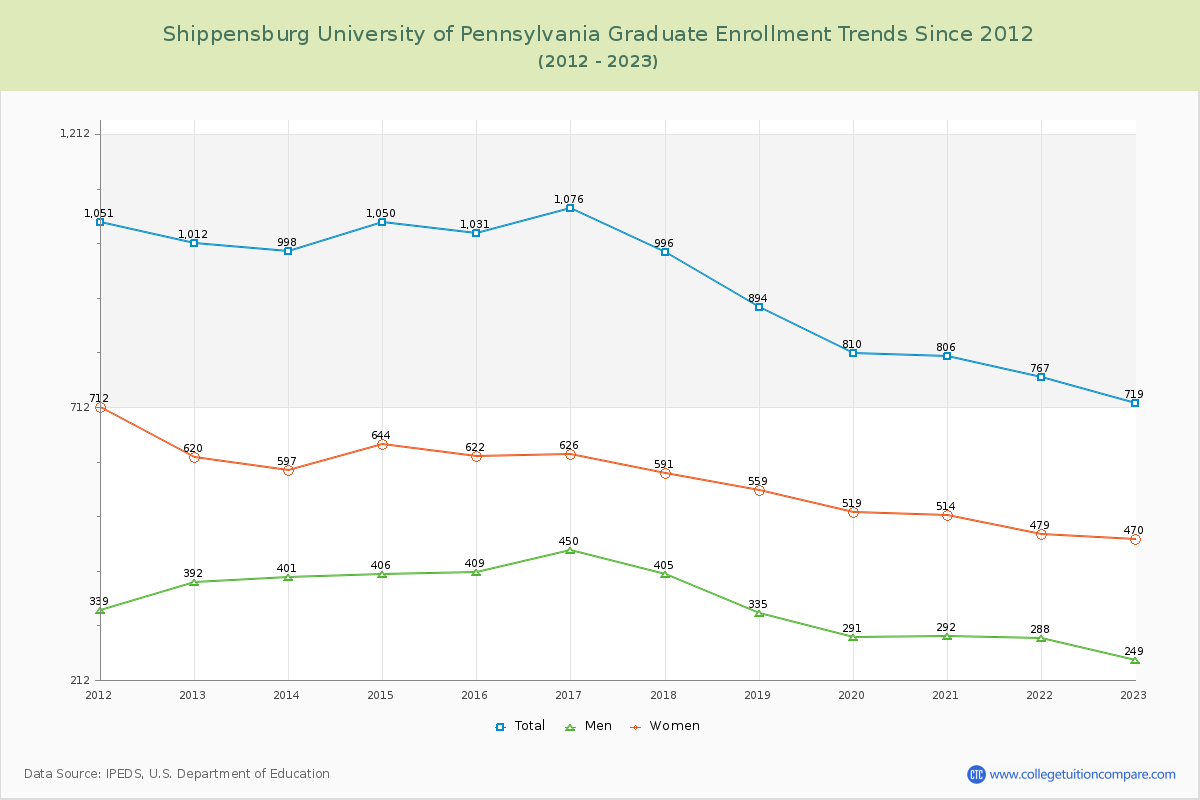
86.07% of total students is undergraduate students and 13.93% students is graduate students. The number of undergraduate students has decreased by 2,269 and the graduate enrollment has decreased by 293 over past 10 years.
The female to male ratio is 1.15 to 1 and it means that there are slightly more female students enrolled in SU than male students.
The following table and chart illustrate the changes in student population by gender at Shippensburg University of Pennsylvania since 2012.
| Year | Total | Undergraduate | Graduate | ||||
|---|---|---|---|---|---|---|---|
| Total | Men | Women | Total | Men | Women | ||
| 2012-13 | 7,724 | 6,712 | 3,336 | 3,376 | 1,012 | 392 | 620 |
| 2013-14 | 7,548 -176 | 6,550 -162 | 3,299 -37 | 3,251 -125 | 998 -14 | 401 9 | 597 -23 |
| 2014-15 | 7,355 -193 | 6,305 -245 | 3,209 -90 | 3,096 -155 | 1,050 52 | 406 5 | 644 47 |
| 2015-16 | 7,048 -307 | 6,017 -288 | 3,037 -172 | 2,980 -116 | 1,031 -19 | 409 3 | 622 -22 |
| 2016-17 | 6,972 -76 | 5,896 -121 | 2,979 -58 | 2,917 -63 | 1,076 45 | 450 41 | 626 4 |
| 2017-18 | 6,570 -402 | 5,574 -322 | 2,766 -213 | 2,808 -109 | 996 -80 | 405 -45 | 591 -35 |
| 2018-19 | 6,381 -189 | 5,487 -87 | 2,652 -114 | 2,835 27 | 894 -102 | 335 -70 | 559 -32 |
| 2019-20 | 6,084 -297 | 5,274 -213 | 2,530 -122 | 2,744 -91 | 810 -84 | 291 -44 | 519 -40 |
| 2020-21 | 6,130 46 | 5,324 50 | 2,491 -39 | 2,833 89 | 806 -4 | 292 1 | 514 -5 |
| 2021-22 | 5,667 -463 | 4,900 -424 | 2,314 -177 | 2,586 -247 | 767 -39 | 288 -4 | 479 -35 |
| 2022-23 | 5,162 -505 | 4,443 -457 | 2,152 -162 | 2,291 -295 | 719 -48 | 249 -39 | 470 -9 |
| Average | 6,604 | 5,680 | 2,797 | 2,883 | 924 | 356 | 567 |