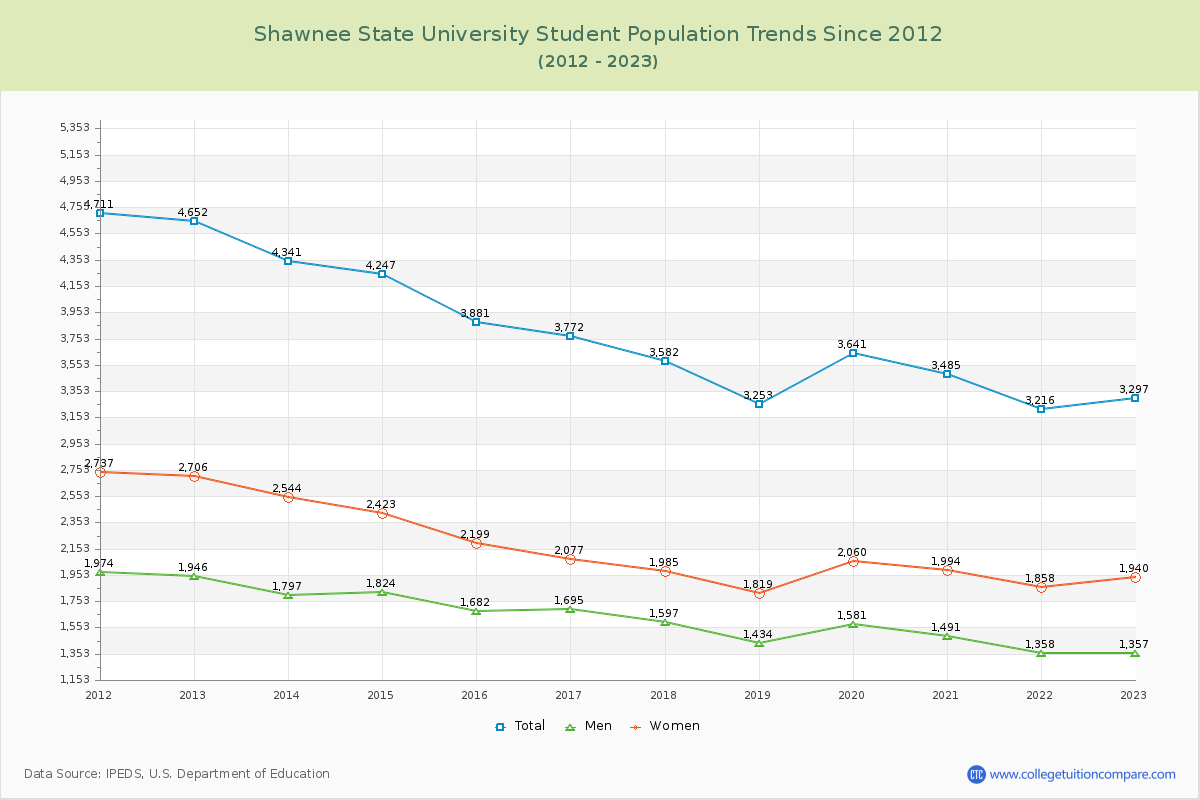
Student Population Changes
The average student population over the last 12 years is 3,761 where 3,297 students are attending the school for the academic year 2022-2023.
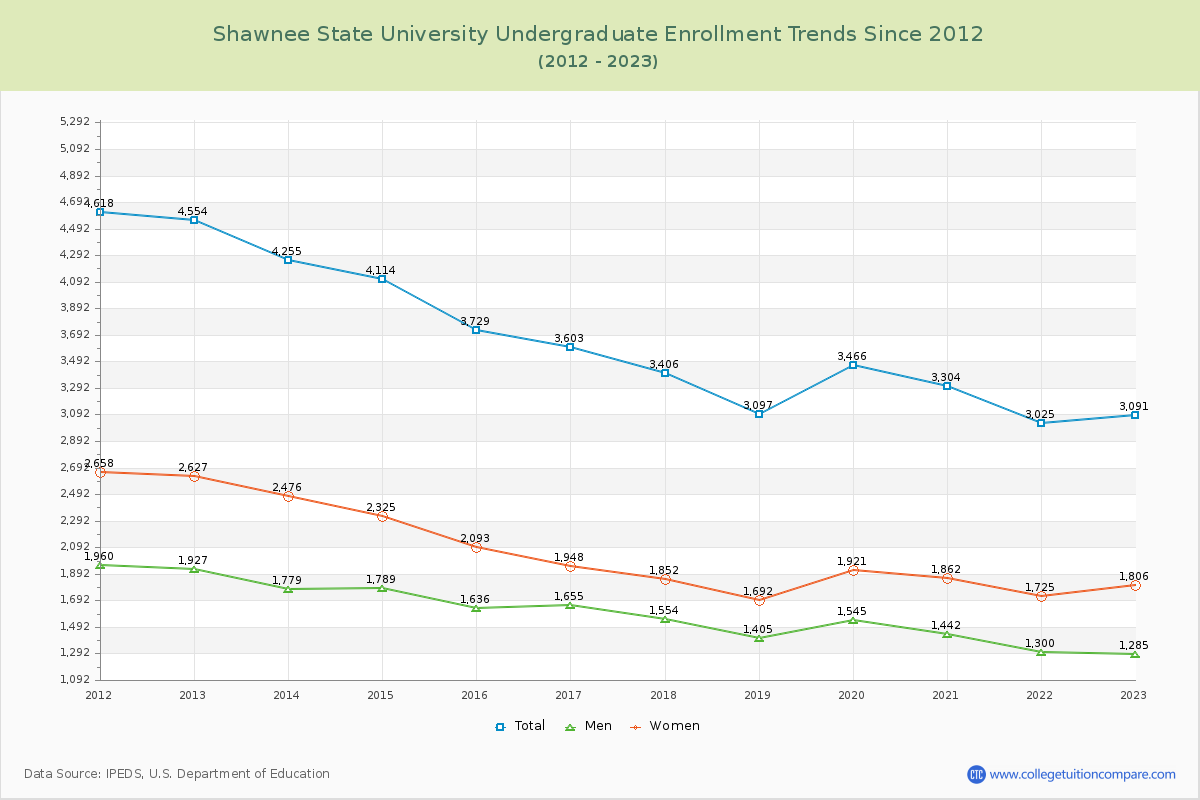
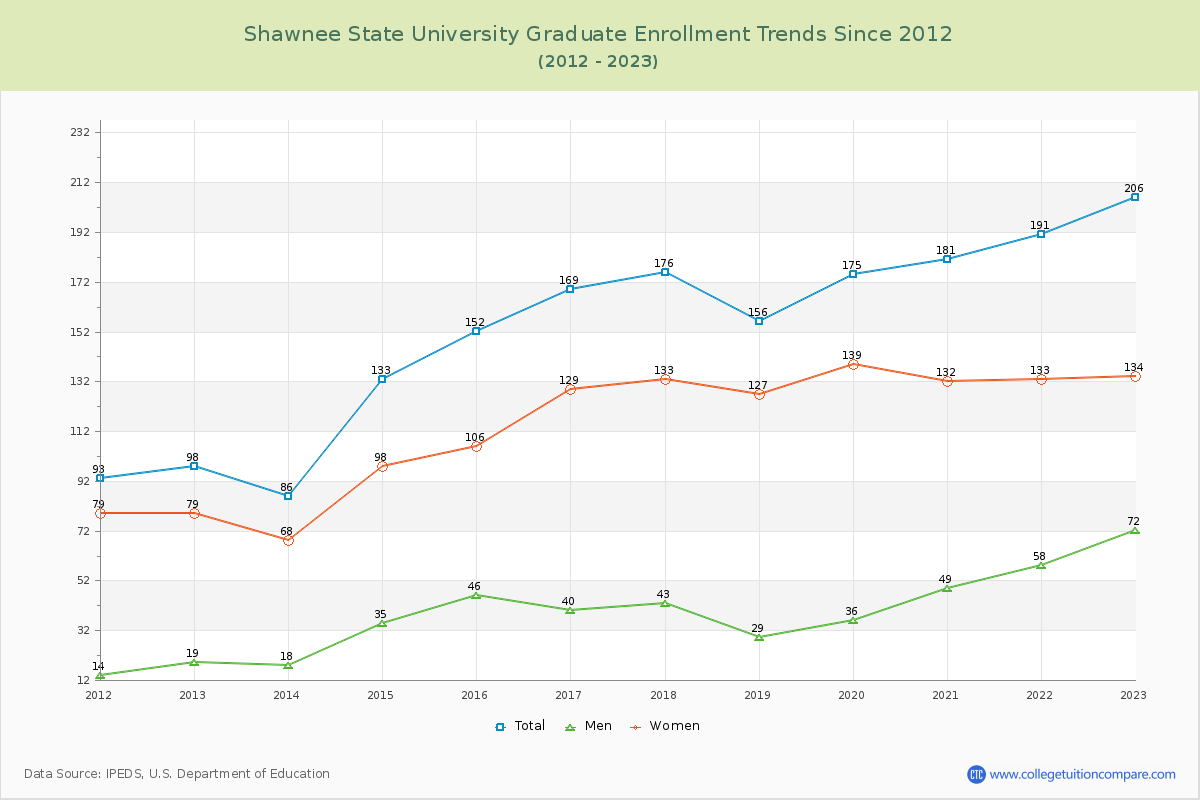
93.75% of total students is undergraduate students and 6.25% students is graduate students. The number of undergraduate students has decreased by 1,463 and the graduate enrollment has increased by 108 over past 10 years.
The female to male ratio is 1.43 to 1 and it means that there are more female students enrolled in Shawnee State than male students.
The following table and chart illustrate the changes in student population by gender at Shawnee State University since 2012.
| Year | Total | Undergraduate | Graduate | ||||
|---|---|---|---|---|---|---|---|
| Total | Men | Women | Total | Men | Women | ||
| 2012-13 | 4,652 | 4,554 | 1,927 | 2,627 | 98 | 19 | 79 |
| 2013-14 | 4,341 -311 | 4,255 -299 | 1,779 -148 | 2,476 -151 | 86 -12 | 18 -1 | 68 -11 |
| 2014-15 | 4,247 -94 | 4,114 -141 | 1,789 10 | 2,325 -151 | 133 47 | 35 17 | 98 30 |
| 2015-16 | 3,881 -366 | 3,729 -385 | 1,636 -153 | 2,093 -232 | 152 19 | 46 11 | 106 8 |
| 2016-17 | 3,772 -109 | 3,603 -126 | 1,655 19 | 1,948 -145 | 169 17 | 40 -6 | 129 23 |
| 2017-18 | 3,582 -190 | 3,406 -197 | 1,554 -101 | 1,852 -96 | 176 7 | 43 3 | 133 4 |
| 2018-19 | 3,253 -329 | 3,097 -309 | 1,405 -149 | 1,692 -160 | 156 -20 | 29 -14 | 127 -6 |
| 2019-20 | 3,641 388 | 3,466 369 | 1,545 140 | 1,921 229 | 175 19 | 36 7 | 139 12 |
| 2020-21 | 3,485 -156 | 3,304 -162 | 1,442 -103 | 1,862 -59 | 181 6 | 49 13 | 132 -7 |
| 2021-22 | 3,216 -269 | 3,025 -279 | 1,300 -142 | 1,725 -137 | 191 10 | 58 9 | 133 1 |
| 2022-23 | 3,297 81 | 3,091 66 | 1,285 -15 | 1,806 81 | 206 15 | 72 14 | 134 1 |
| Average | 3,761 | 3,604 | 1,574 | 2,030 | 157 | 40 | 116 |