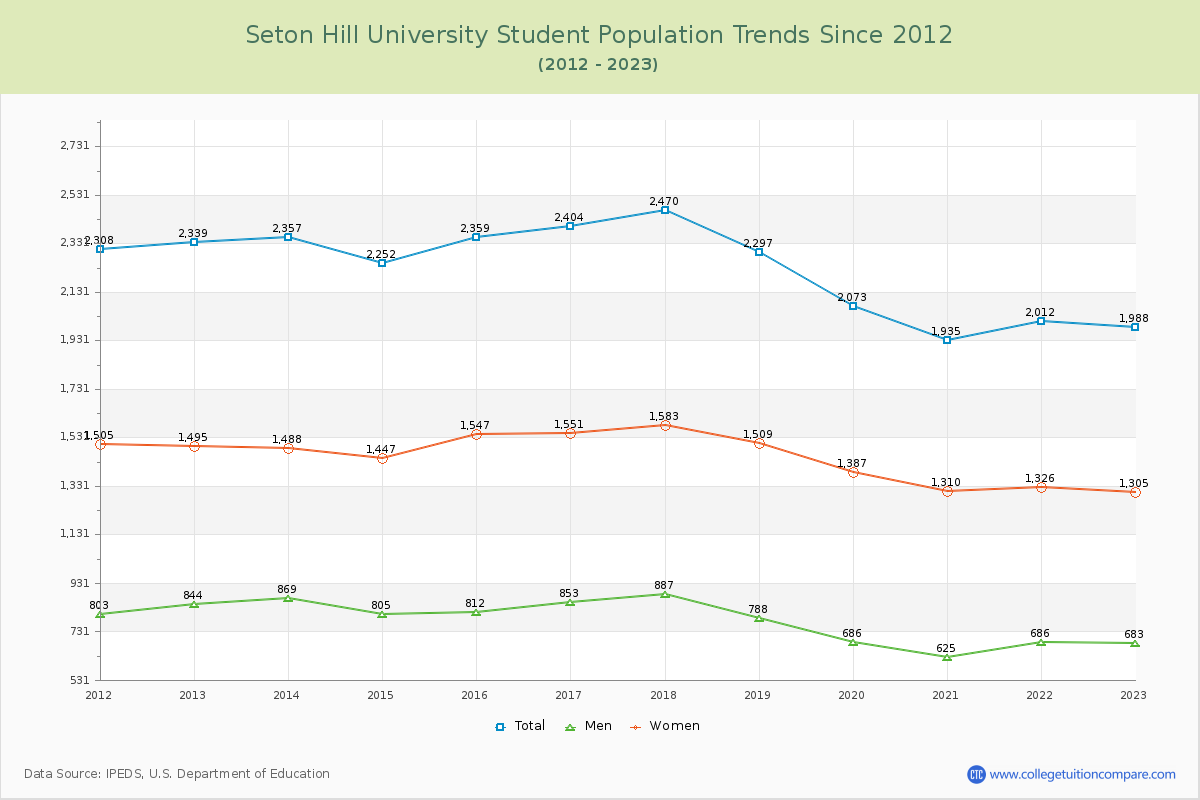
Student Population Changes
The average student population over the last 12 years is 2,226 where 1,988 students are attending the school for the academic year 2022-2023.
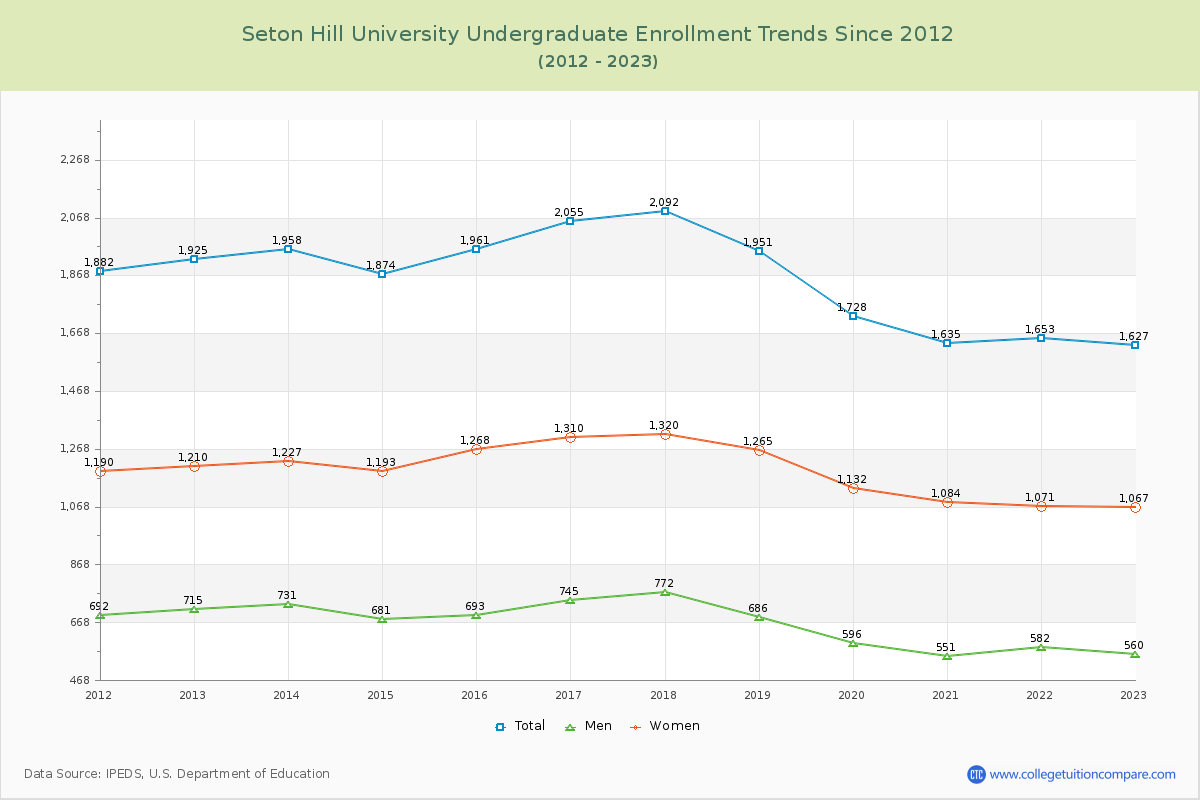
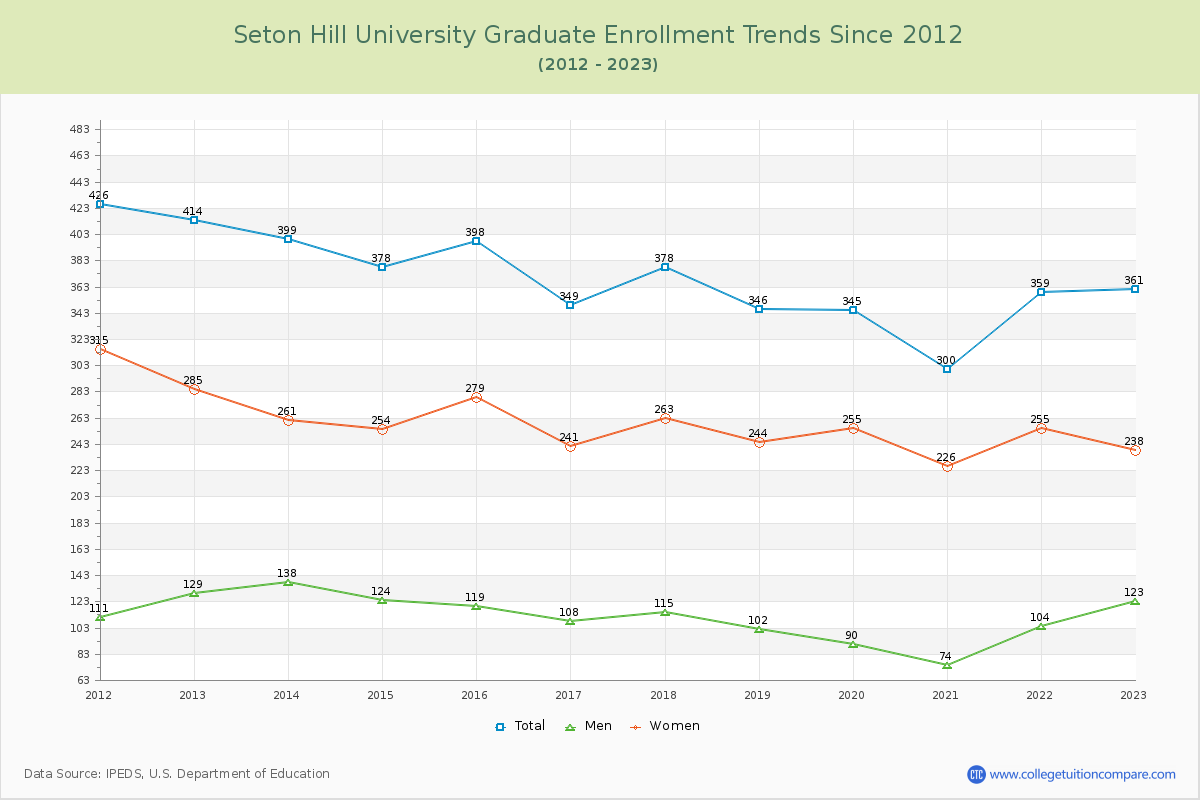
81.84% of total students is undergraduate students and 18.16% students is graduate students. The number of undergraduate students has decreased by 298 and the graduate enrollment has decreased by 53 over past 10 years.
The female to male ratio is 1.91 to 1 and it means that there are more female students enrolled in Seton Hill than male students.
The following table and chart illustrate the changes in student population by gender at Seton Hill University since 2012.
| Year | Total | Undergraduate | Graduate | ||||
|---|---|---|---|---|---|---|---|
| Total | Men | Women | Total | Men | Women | ||
| 2012-13 | 2,339 | 1,925 | 715 | 1,210 | 414 | 129 | 285 |
| 2013-14 | 2,357 18 | 1,958 33 | 731 16 | 1,227 17 | 399 -15 | 138 9 | 261 -24 |
| 2014-15 | 2,252 -105 | 1,874 -84 | 681 -50 | 1,193 -34 | 378 -21 | 124 -14 | 254 -7 |
| 2015-16 | 2,359 107 | 1,961 87 | 693 12 | 1,268 75 | 398 20 | 119 -5 | 279 25 |
| 2016-17 | 2,404 45 | 2,055 94 | 745 52 | 1,310 42 | 349 -49 | 108 -11 | 241 -38 |
| 2017-18 | 2,470 66 | 2,092 37 | 772 27 | 1,320 10 | 378 29 | 115 7 | 263 22 |
| 2018-19 | 2,297 -173 | 1,951 -141 | 686 -86 | 1,265 -55 | 346 -32 | 102 -13 | 244 -19 |
| 2019-20 | 2,073 -224 | 1,728 -223 | 596 -90 | 1,132 -133 | 345 -1 | 90 -12 | 255 11 |
| 2020-21 | 1,935 -138 | 1,635 -93 | 551 -45 | 1,084 -48 | 300 -45 | 74 -16 | 226 -29 |
| 2021-22 | 2,012 77 | 1,653 18 | 582 31 | 1,071 -13 | 359 59 | 104 30 | 255 29 |
| 2022-23 | 1,988 -24 | 1,627 -26 | 560 -22 | 1,067 -4 | 361 2 | 123 19 | 238 -17 |
| Average | 2,226 | 1,860 | 665 | 1,195 | 366 | 111 | 255 |