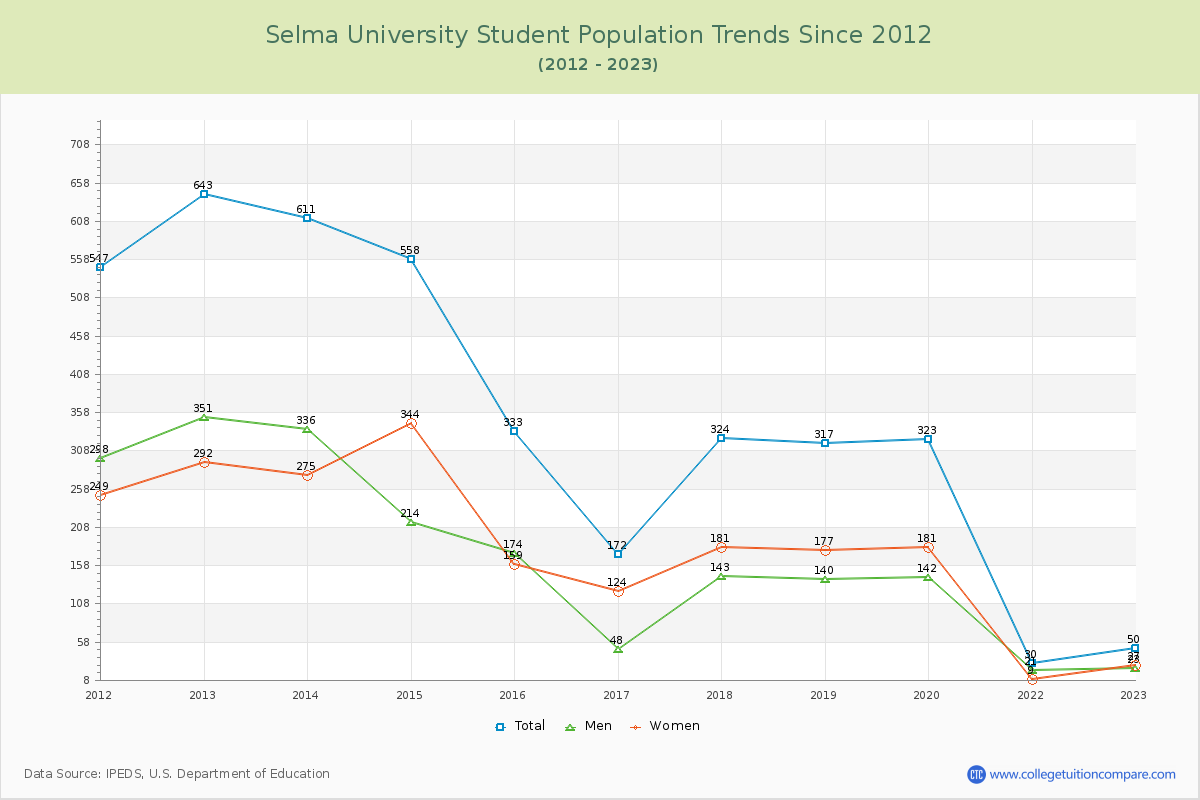
Student Population Changes
The average student population over the last 12 years is 306 where 50 students are attending the school for the academic year 2022-2023.
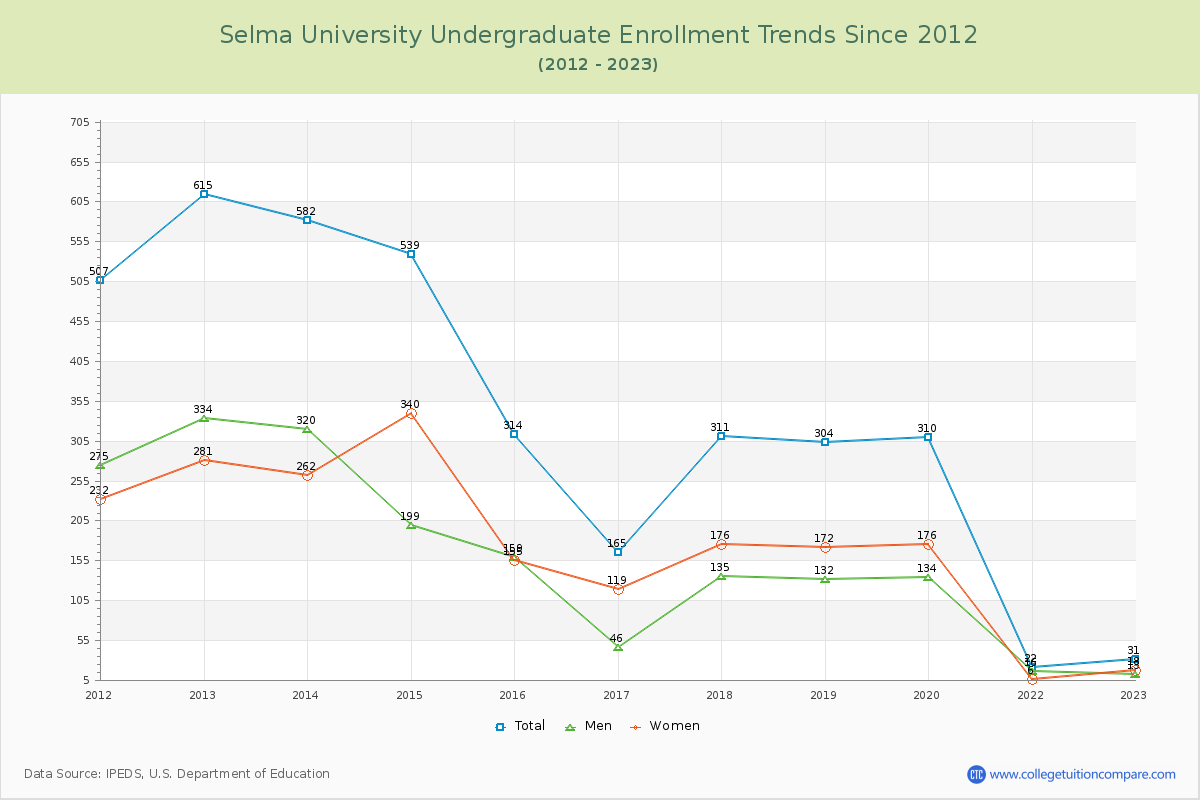
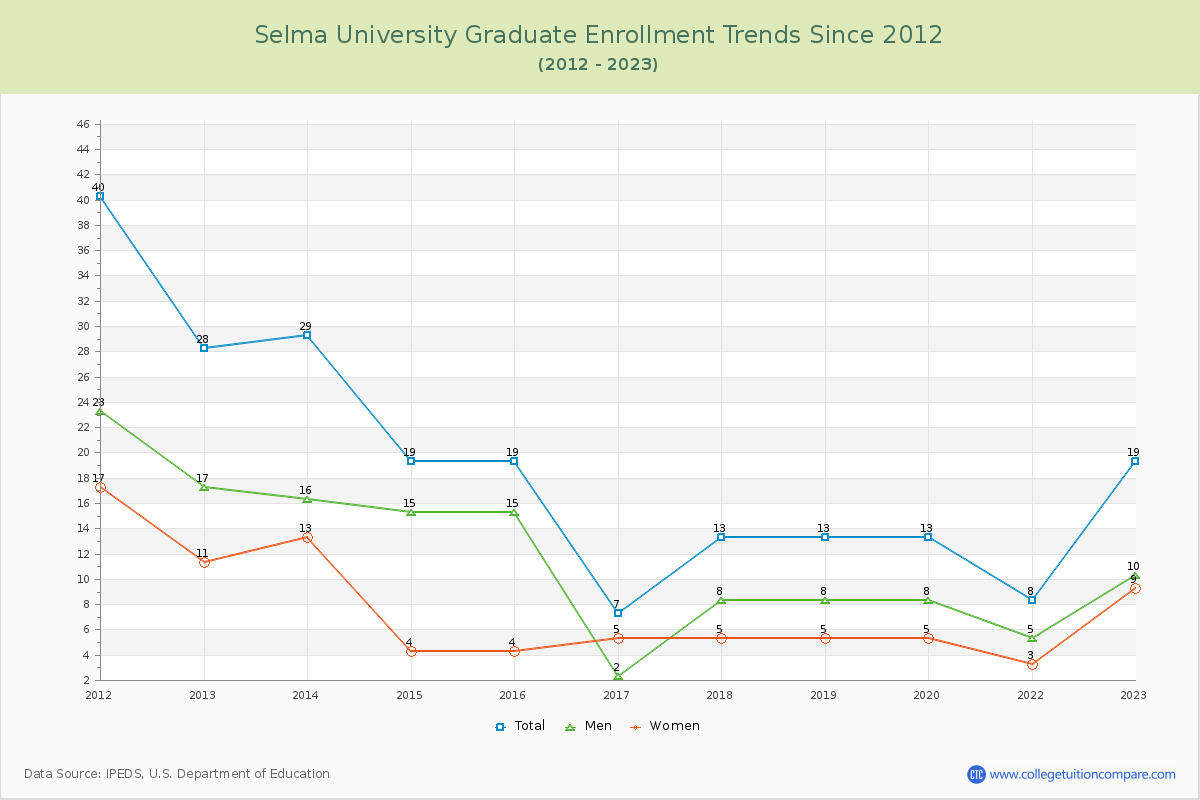
62.00% of total students is undergraduate students and 38.00% students is graduate students. The number of undergraduate students has decreased by 584 and the graduate enrollment has decreased by 9 over past 10 years.
The female to male ratio is 1.17 to 1 and it means that there are slightly more female students enrolled in Selma than male students.
The following table and chart illustrate the changes in student population by gender at Selma University since 2012.
| Year | Total | Undergraduate | Graduate | ||||
|---|---|---|---|---|---|---|---|
| Total | Men | Women | Total | Men | Women | ||
| 2012-13 | 643 | 615 | 334 | 281 | 28 | 17 | 11 |
| 2013-14 | 611 -32 | 582 -33 | 320 -14 | 262 -19 | 29 1 | 16 -1 | 13 2 |
| 2014-15 | 558 -53 | 539 -43 | 199 -121 | 340 78 | 19 -10 | 15 -1 | 4 -9 |
| 2015-16 | 333 -225 | 314 -225 | 159 -40 | 155 -185 | 19 0 | 15 0 | 4 0 |
| 2016-17 | 172 -161 | 165 -149 | 46 -113 | 119 -36 | 7 -12 | 2 -13 | 5 1 |
| 2017-18 | 324 152 | 311 146 | 135 89 | 176 57 | 13 6 | 8 6 | 5 0 |
| 2018-19 | 317 -7 | 304 -7 | 132 -3 | 172 -4 | 13 0 | 8 0 | 5 0 |
| 2019-20 | 323 6 | 310 6 | 134 2 | 176 4 | 13 0 | 8 0 | 5 0 |
| 2020-21 | 0 -323 | 0 -310 | 0 -134 | 0 -176 | 0 -13 | 0 -8 | 0 -5 |
| 2021-22 | 30 30 | 22 22 | 16 16 | 6 6 | 8 8 | 5 5 | 3 3 |
| 2022-23 | 50 20 | 31 9 | 13 -3 | 18 12 | 19 11 | 10 5 | 9 6 |
| Average | 306 | 290 | 135 | 155 | 15 | 9 | 6 |