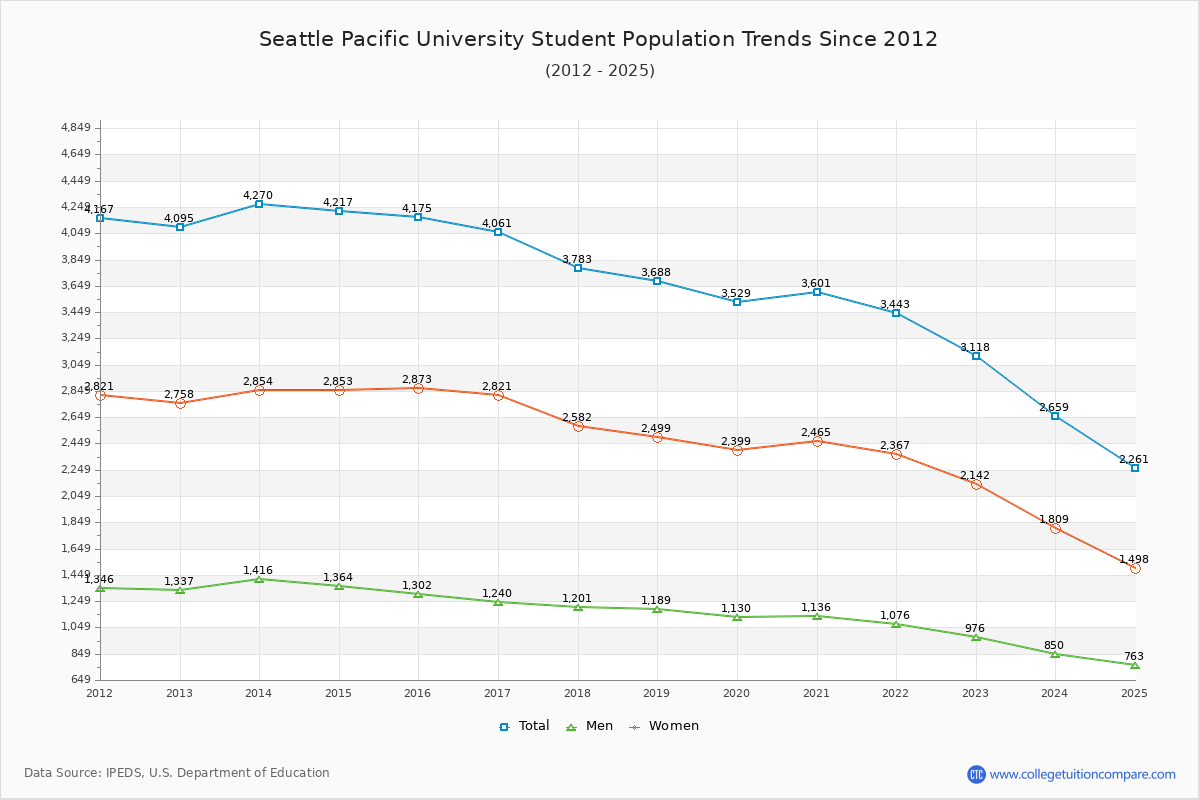
Student Population Changes
The average student population over the last 12 years is 3,816 where 3,118 students are attending the school for the academic year 2022-2023.
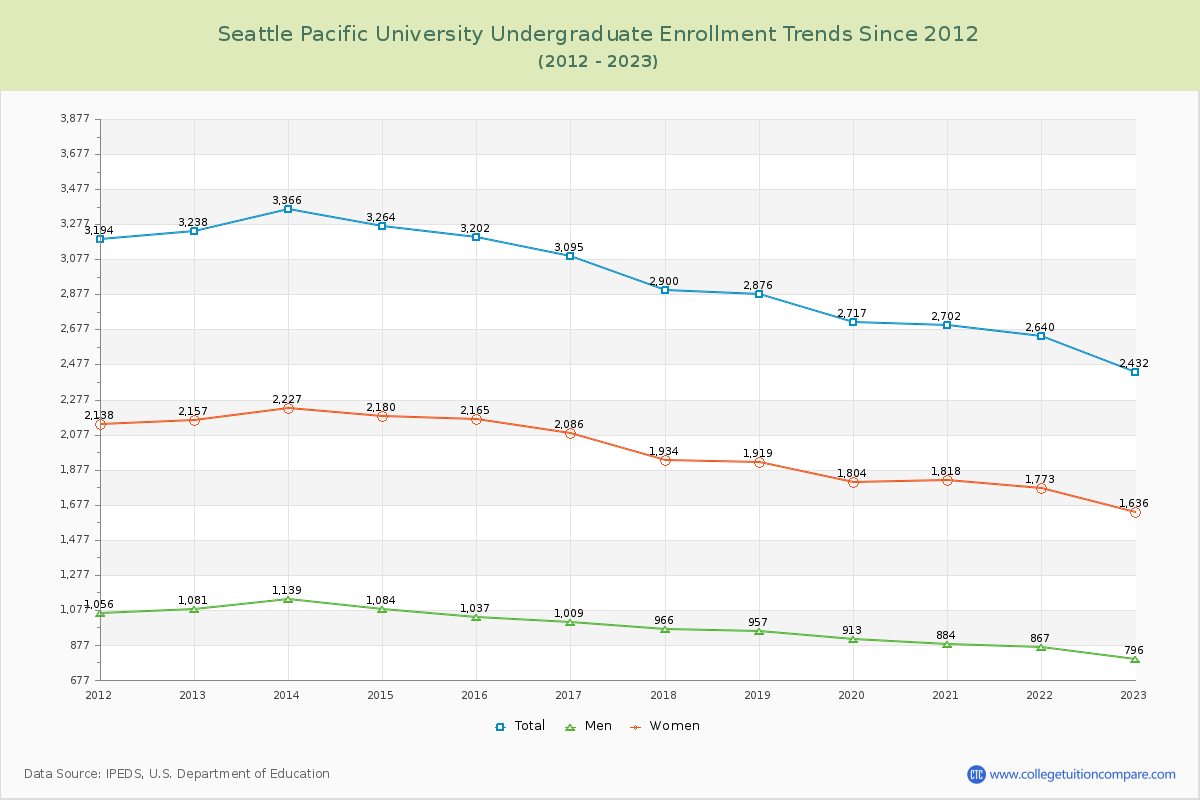
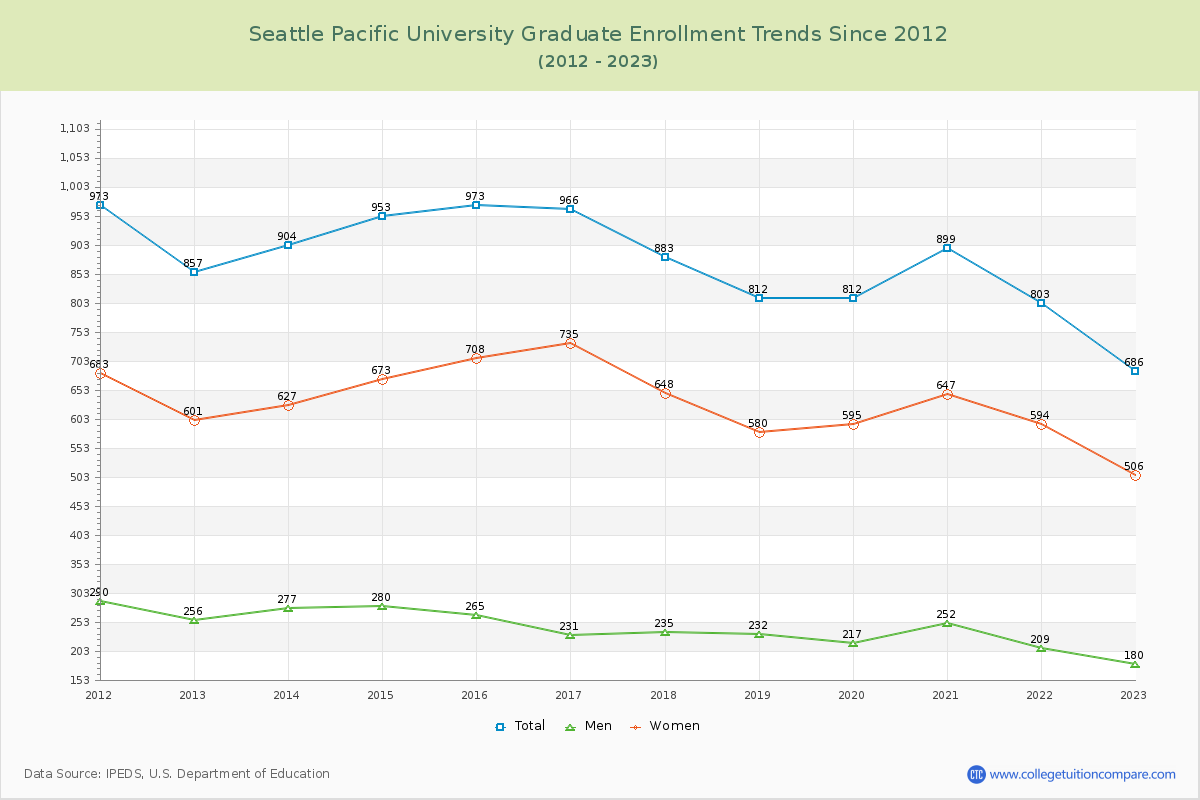
78.00% of total students is undergraduate students and 22.00% students is graduate students. The number of undergraduate students has decreased by 806 and the graduate enrollment has decreased by 171 over past 10 years.
The female to male ratio is 2.19 to 1 and it means that there are far more female students enrolled in SPU than male students.
The following table and chart illustrate the changes in student population by gender at Seattle Pacific University since 2012.
| Year | Total | Undergraduate | Graduate | ||||
|---|---|---|---|---|---|---|---|
| Total | Men | Women | Total | Men | Women | ||
| 2012-13 | 4,095 | 3,238 | 1,081 | 2,157 | 857 | 256 | 601 |
| 2013-14 | 4,270 175 | 3,366 128 | 1,139 58 | 2,227 70 | 904 47 | 277 21 | 627 26 |
| 2014-15 | 4,217 -53 | 3,264 -102 | 1,084 -55 | 2,180 -47 | 953 49 | 280 3 | 673 46 |
| 2015-16 | 4,175 -42 | 3,202 -62 | 1,037 -47 | 2,165 -15 | 973 20 | 265 -15 | 708 35 |
| 2016-17 | 4,061 -114 | 3,095 -107 | 1,009 -28 | 2,086 -79 | 966 -7 | 231 -34 | 735 27 |
| 2017-18 | 3,783 -278 | 2,900 -195 | 966 -43 | 1,934 -152 | 883 -83 | 235 4 | 648 -87 |
| 2018-19 | 3,688 -95 | 2,876 -24 | 957 -9 | 1,919 -15 | 812 -71 | 232 -3 | 580 -68 |
| 2019-20 | 3,529 -159 | 2,717 -159 | 913 -44 | 1,804 -115 | 812 0 | 217 -15 | 595 15 |
| 2020-21 | 3,601 72 | 2,702 -15 | 884 -29 | 1,818 14 | 899 87 | 252 35 | 647 52 |
| 2021-22 | 3,443 -158 | 2,640 -62 | 867 -17 | 1,773 -45 | 803 -96 | 209 -43 | 594 -53 |
| 2022-23 | 3,118 -325 | 2,432 -208 | 796 -71 | 1,636 -137 | 686 -117 | 180 -29 | 506 -88 |
| Average | 3,816 | 2,948 | 976 | 1,973 | 868 | 239 | 629 |