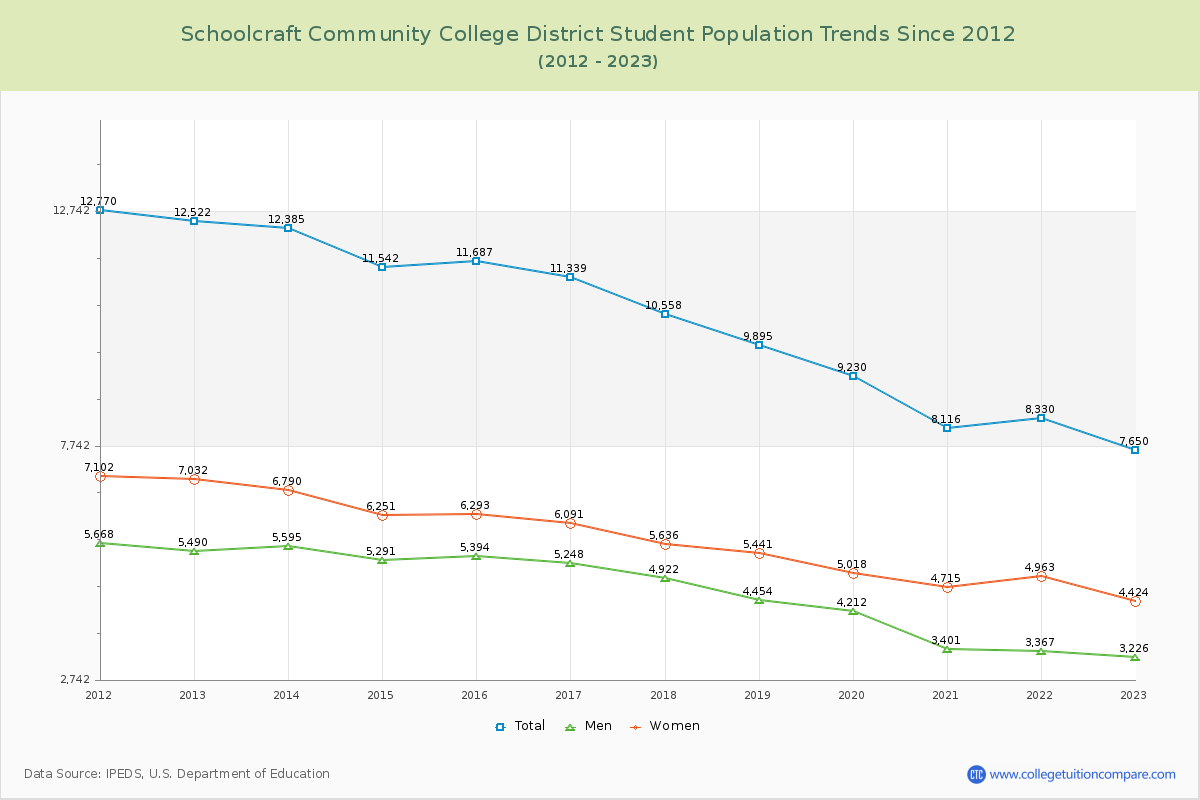
Student Population Changes
The average student population over the last 12 years is 10,296 where 7,650 students are attending the school for the academic year 2022-2023.
The female to male ratio is 1.37 to 1 and it means that there are more female students enrolled in Schoolcraft Community College District than male students.
The following table and chart illustrate the changes in student population by gender at Schoolcraft Community College District since 2012.
| Year | Total | Men | Women |
|---|---|---|---|
| 2012-13 | 12,522 | 5,490 | 7,032 |
| 2013-14 | 12,385 -137 | 5,595 105 | 6,790 -242 |
| 2014-15 | 11,542 -843 | 5,291 -304 | 6,251 -539 |
| 2015-16 | 11,687 145 | 5,394 103 | 6,293 42 |
| 2016-17 | 11,339 -348 | 5,248 -146 | 6,091 -202 |
| 2017-18 | 10,558 -781 | 4,922 -326 | 5,636 -455 |
| 2018-19 | 9,895 -663 | 4,454 -468 | 5,441 -195 |
| 2019-20 | 9,230 -665 | 4,212 -242 | 5,018 -423 |
| 2020-21 | 8,116 -1,114 | 3,401 -811 | 4,715 -303 |
| 2021-22 | 8,330 214 | 3,367 -34 | 4,963 248 |
| 2022-23 | 7,650 -680 | 3,226 -141 | 4,424 -539 |
| Average | 10,296 | 4,600 | 5,696 |