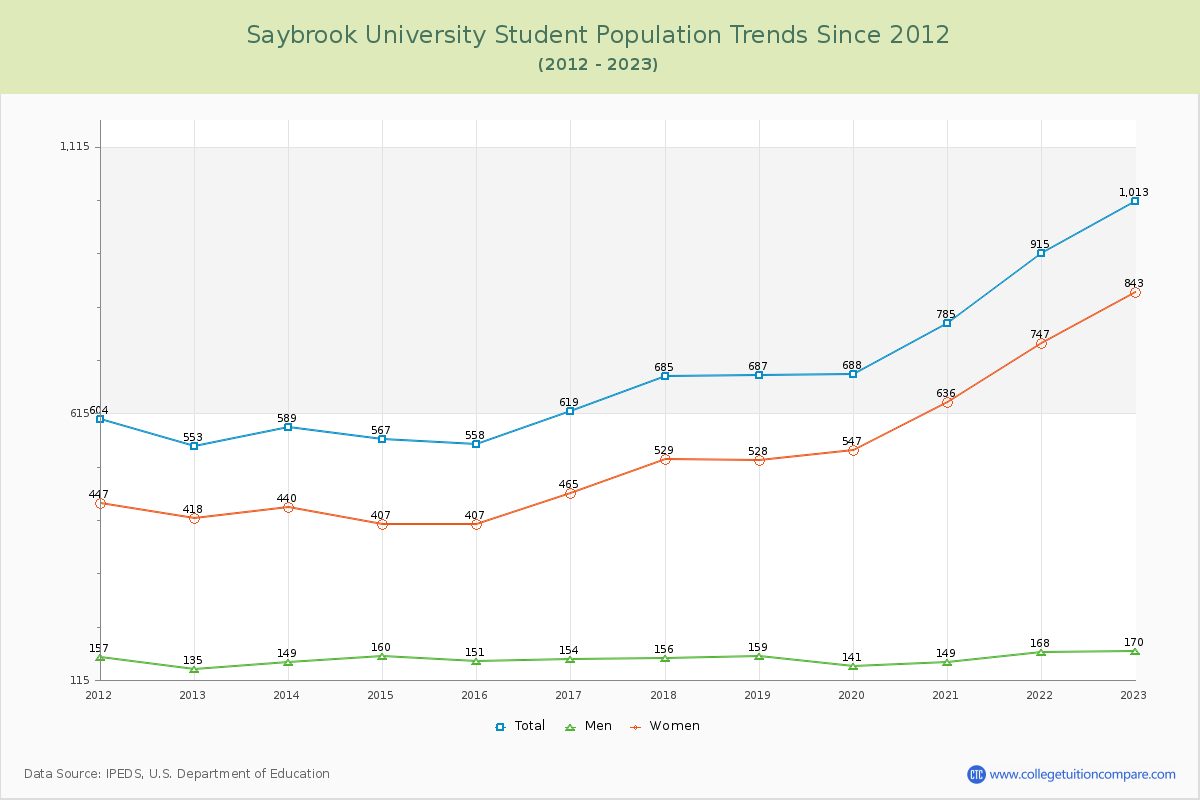
Student Population Changes
The average student population over the last 12 years is 696 where 1,013 students are attending the school for the academic year 2022-2023.
The female to male ratio is 4.96 to 1 and it means that there are far more female students enrolled in Saybrook than male students.
The following table and chart illustrate the changes in student population by gender at Saybrook University since 2012.
| Year | Total | Men | Women |
|---|---|---|---|
| 2012-13 | 553 | 135 | 418 |
| 2013-14 | 589 36 | 149 14 | 440 22 |
| 2014-15 | 567 -22 | 160 11 | 407 -33 |
| 2015-16 | 558 -9 | 151 -9 | 407 0 |
| 2016-17 | 619 61 | 154 3 | 465 58 |
| 2017-18 | 685 66 | 156 2 | 529 64 |
| 2018-19 | 687 2 | 159 3 | 528 -1 |
| 2019-20 | 688 1 | 141 -18 | 547 19 |
| 2020-21 | 785 97 | 149 8 | 636 89 |
| 2021-22 | 915 130 | 168 19 | 747 111 |
| 2022-23 | 1,013 98 | 170 2 | 843 96 |
| Average | 696 | 154 | 542 |