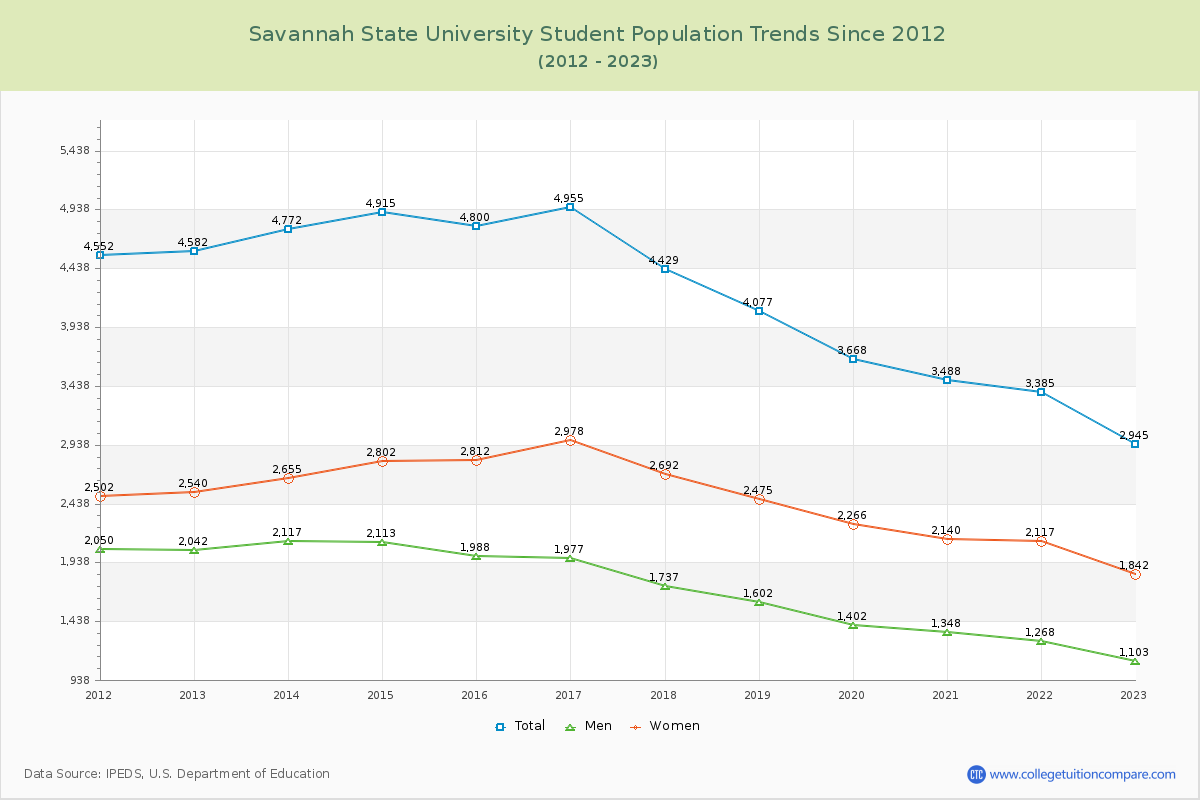
Student Population Changes
The average student population over the last 12 years is 4,183 where 2,945 students are attending the school for the academic year 2022-2023.
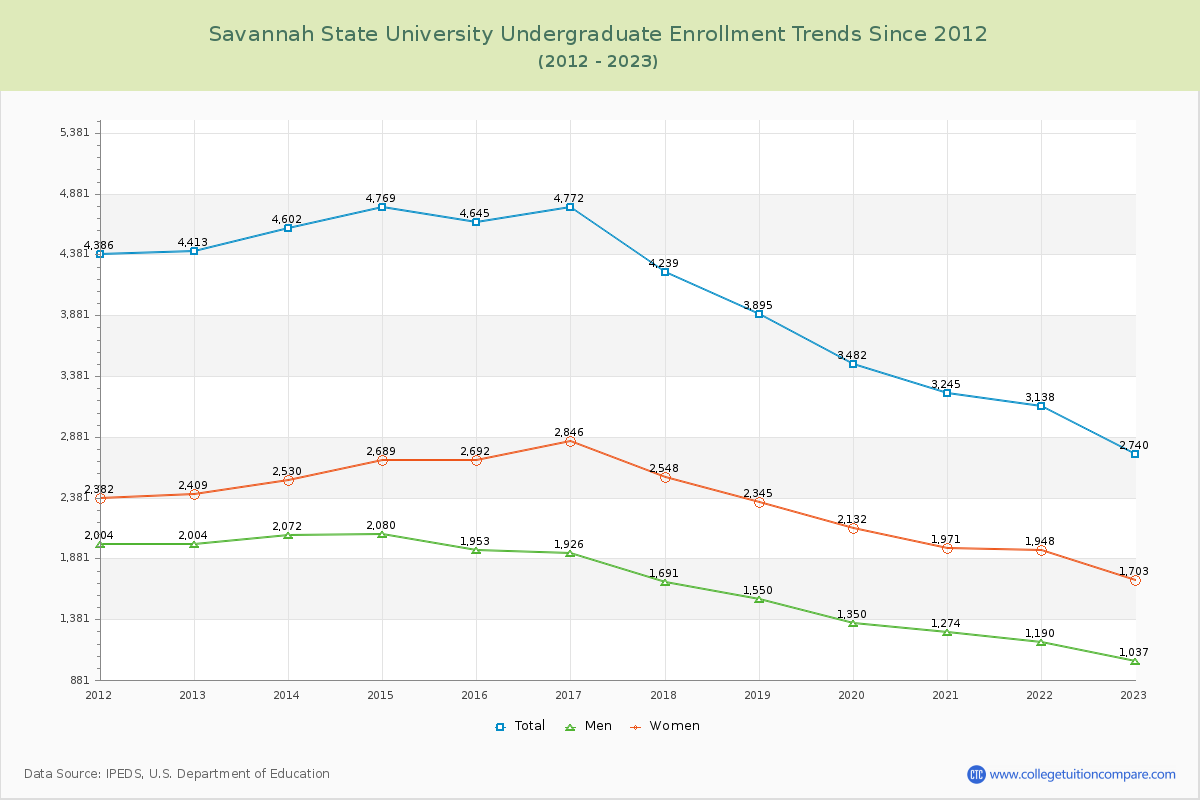
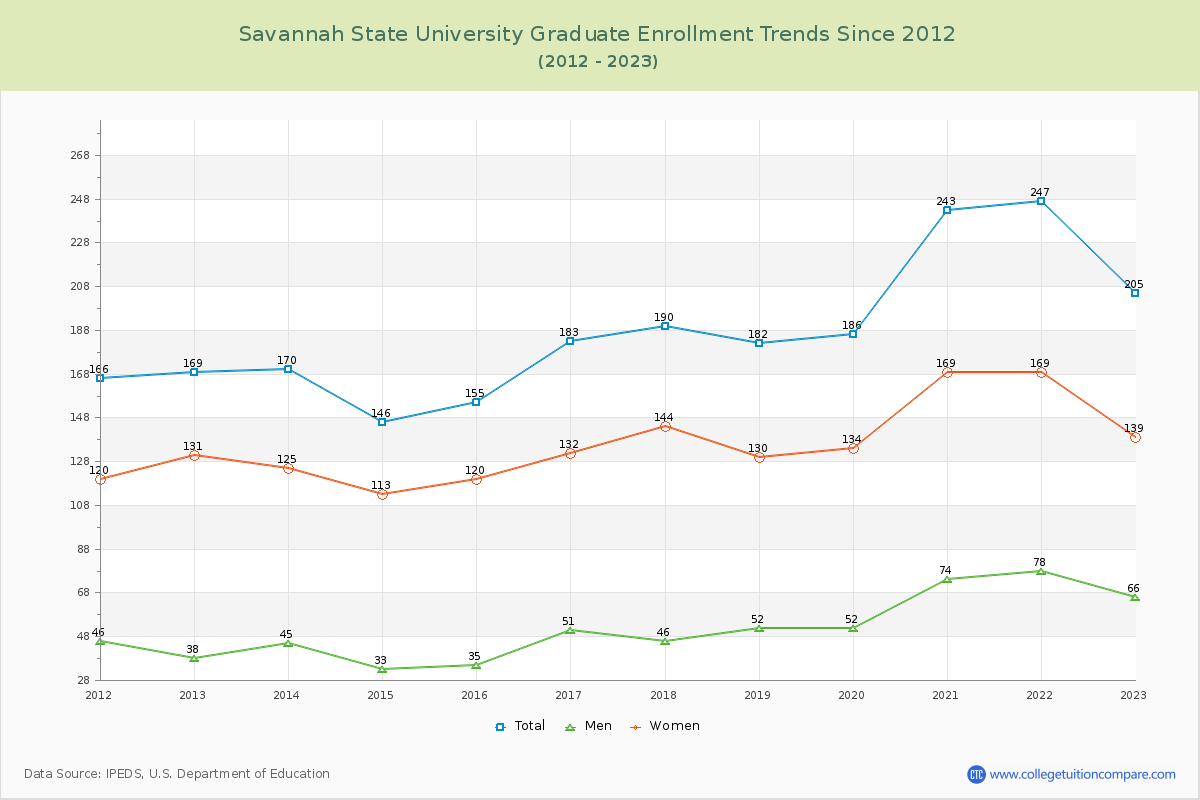
93.04% of total students is undergraduate students and 6.96% students is graduate students. The number of undergraduate students has decreased by 1,673 and the graduate enrollment has increased by 36 over past 10 years.
The female to male ratio is 1.67 to 1 and it means that there are more female students enrolled in Savannah State than male students.
The following table and chart illustrate the changes in student population by gender at Savannah State University since 2012.
| Year | Total | Undergraduate | Graduate | ||||
|---|---|---|---|---|---|---|---|
| Total | Men | Women | Total | Men | Women | ||
| 2012-13 | 4,582 | 4,413 | 2,004 | 2,409 | 169 | 38 | 131 |
| 2013-14 | 4,772 190 | 4,602 189 | 2,072 68 | 2,530 121 | 170 1 | 45 7 | 125 -6 |
| 2014-15 | 4,915 143 | 4,769 167 | 2,080 8 | 2,689 159 | 146 -24 | 33 -12 | 113 -12 |
| 2015-16 | 4,800 -115 | 4,645 -124 | 1,953 -127 | 2,692 3 | 155 9 | 35 2 | 120 7 |
| 2016-17 | 4,955 155 | 4,772 127 | 1,926 -27 | 2,846 154 | 183 28 | 51 16 | 132 12 |
| 2017-18 | 4,429 -526 | 4,239 -533 | 1,691 -235 | 2,548 -298 | 190 7 | 46 -5 | 144 12 |
| 2018-19 | 4,077 -352 | 3,895 -344 | 1,550 -141 | 2,345 -203 | 182 -8 | 52 6 | 130 -14 |
| 2019-20 | 3,668 -409 | 3,482 -413 | 1,350 -200 | 2,132 -213 | 186 4 | 52 0 | 134 4 |
| 2020-21 | 3,488 -180 | 3,245 -237 | 1,274 -76 | 1,971 -161 | 243 57 | 74 22 | 169 35 |
| 2021-22 | 3,385 -103 | 3,138 -107 | 1,190 -84 | 1,948 -23 | 247 4 | 78 4 | 169 0 |
| 2022-23 | 2,945 -440 | 2,740 -398 | 1,037 -153 | 1,703 -245 | 205 -42 | 66 -12 | 139 -30 |
| Average | 4,183 | 3,995 | 1,648 | 2,347 | 189 | 52 | 137 |