SAT Scores Over Time
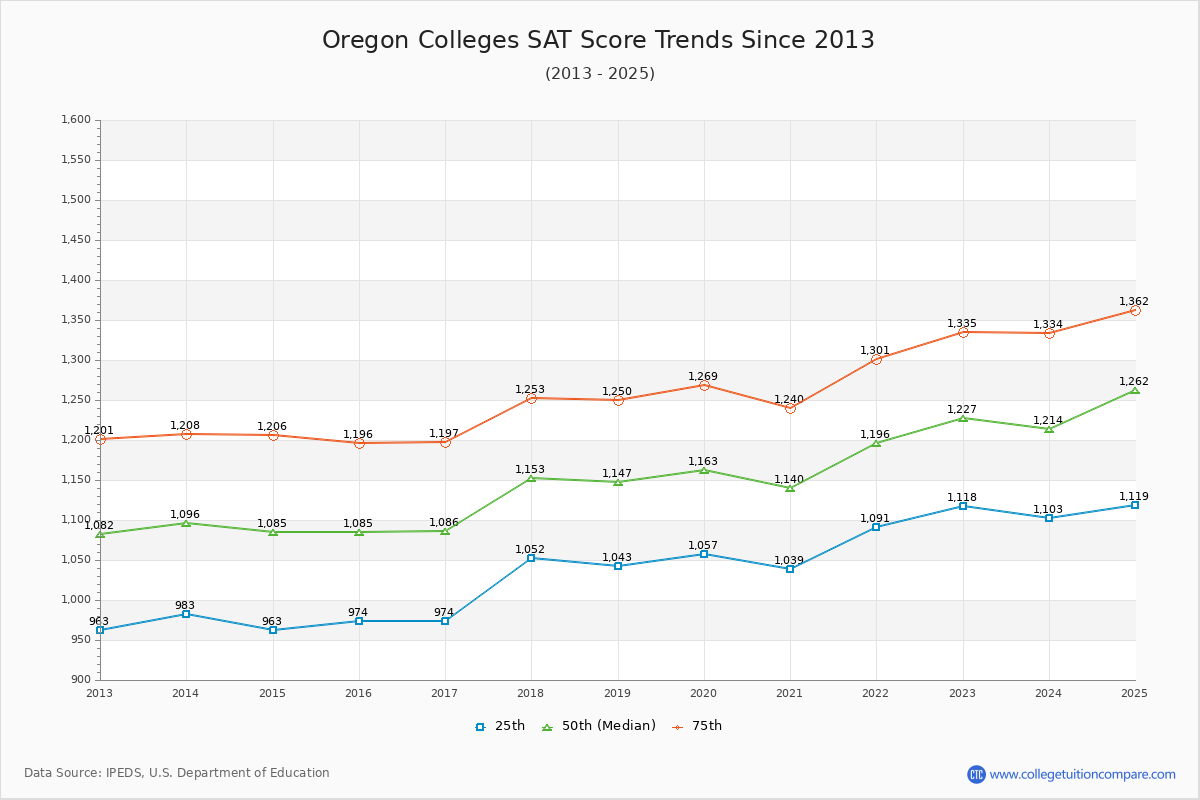
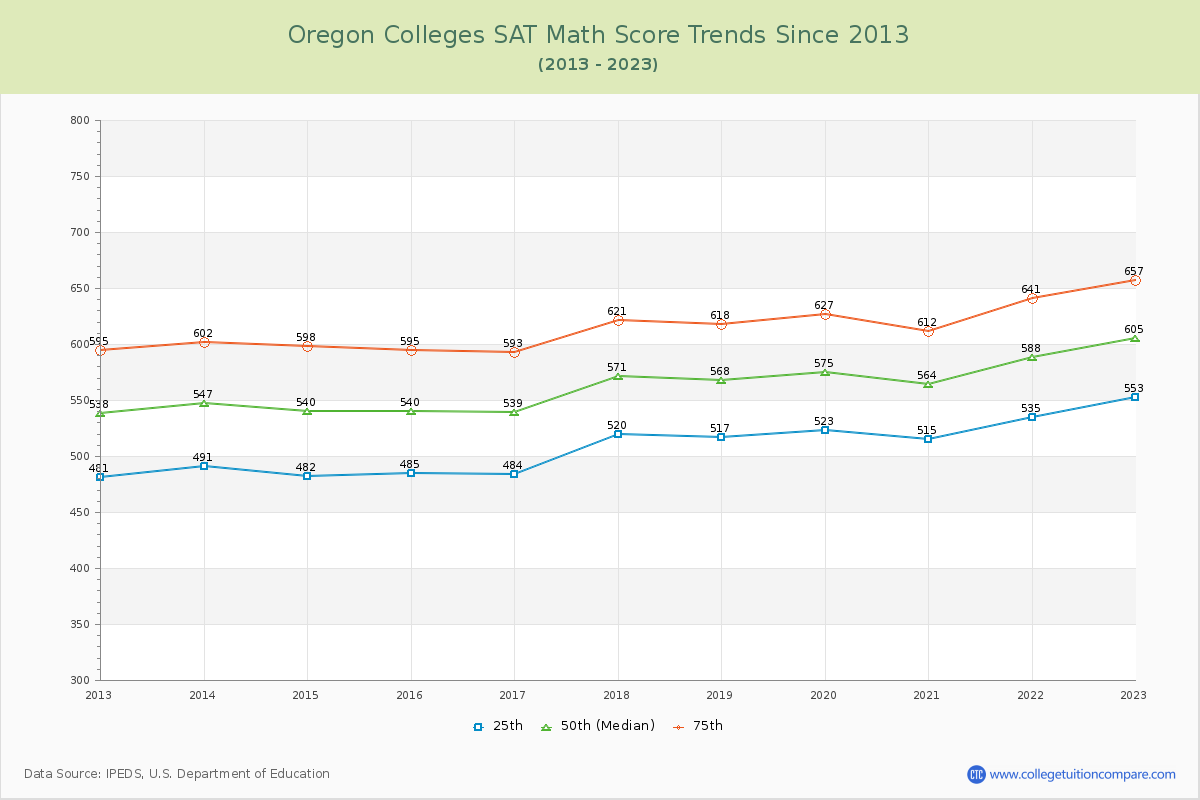
The average SAT score of the last 10 years is 1,023 (25th percentile) and 1,241 (75th percentile). The submitted SAT scores of admitted students are relatively competitive and high (above the national average) at Oregon Colleges. The following table and chart illustrate the changes in SAT scores at Oregon Colleges since 2023.
| Year | Total | Math | Evidence-Based Reading and Writing | ||||||
|---|---|---|---|---|---|---|---|---|---|
| 25th | 50th | 75th | 25th | 50th | 75th | 25th | 50th | 75th | |
| 2012-13 | 963 | 1,082 | 1,201 | 481 | 538 | 595 | 482 | 544 | 606 |
| 2013-14 | 983 | 1,096 | 1,208 | 491 | 547 | 602 | 492 | 549 | 606 |
| 2014-15 | 963 | 1,085 | 1,206 | 482 | 540 | 598 | 481 | 545 | 608 |
| 2015-16 | 974 | 1,085 | 1,196 | 485 | 540 | 595 | 489 | 545 | 601 |
| 2016-17 | 974 | 1,086 | 1,197 | 484 | 539 | 593 | 490 | 547 | 604 |
| 2017-18 | 1,052 | 1,153 | 1,253 | 520 | 571 | 621 | 532 | 582 | 632 |
| 2018-19 | 1,043 | 1,147 | 1,250 | 517 | 568 | 618 | 526 | 579 | 632 |
| 2019-20 | 1,057 | 1,163 | 1,269 | 523 | 575 | 627 | 534 | 588 | 642 |
| 2020-21 | 1,039 | 1,140 | 1,240 | 515 | 564 | 612 | 524 | 576 | 628 |
| 2021-22 | 1,091 | 1,196 | 1,301 | 535 | 588 | 641 | 556 | 608 | 660 |
| 2022-23 | 1,118 | 1,227 | 1,335 | 553 | 605 | 657 | 565 | 622 | 678 |
| Average | 1,023 | 1,132 | 1,241 | 508 | 561 | 614 | 516 | 571 | 627 |
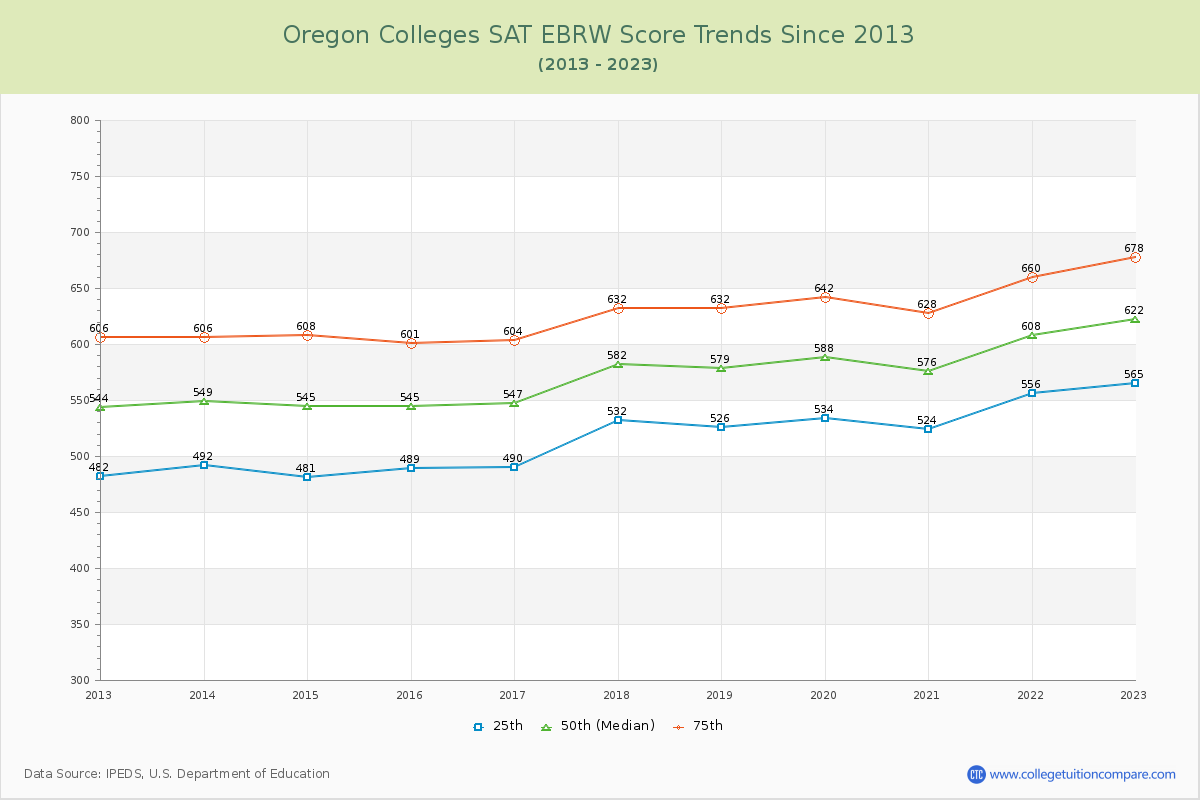
*SAT Evidence-Based Reading and Writing replaces SAT critical reading and writing since year 2017.
**The SAT Writing score is excluded from the total scores for year from 2011 to 2016.