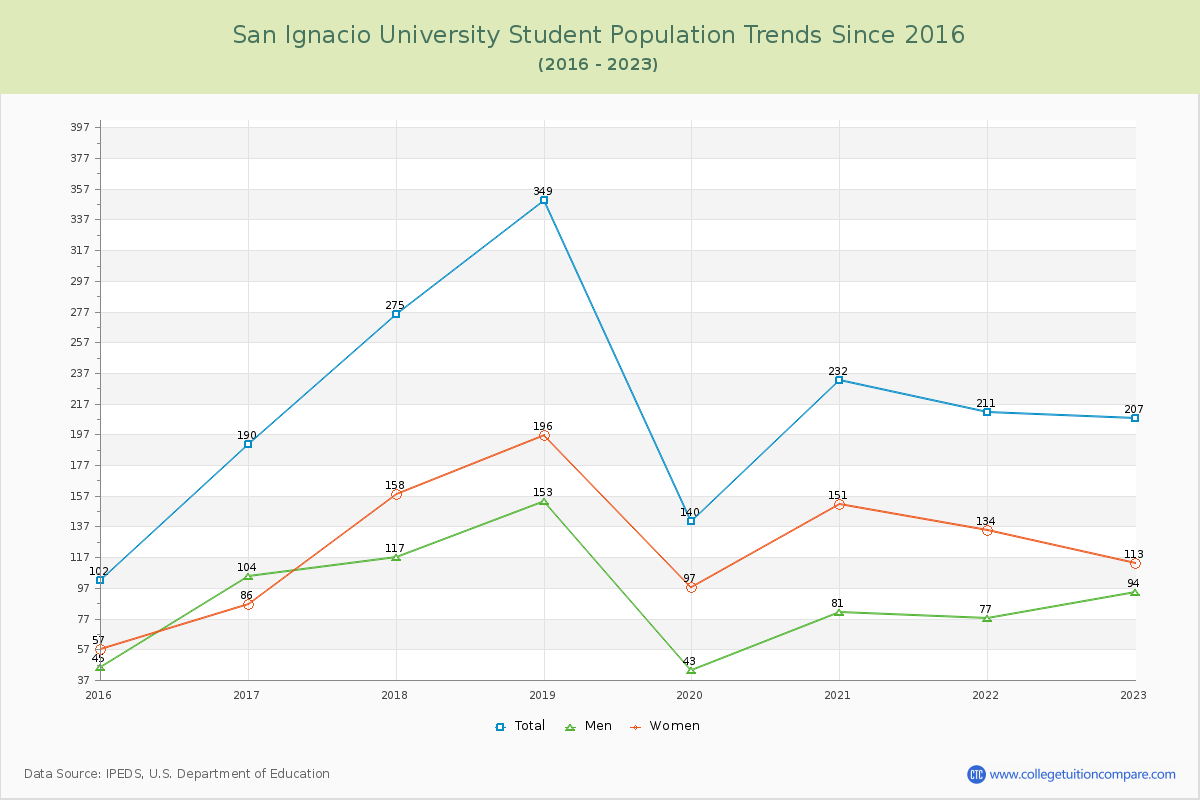
Student Population Changes
The average student population over the last 9 years is 213 where 207 students are attending the school for the academic year 2022-2023.
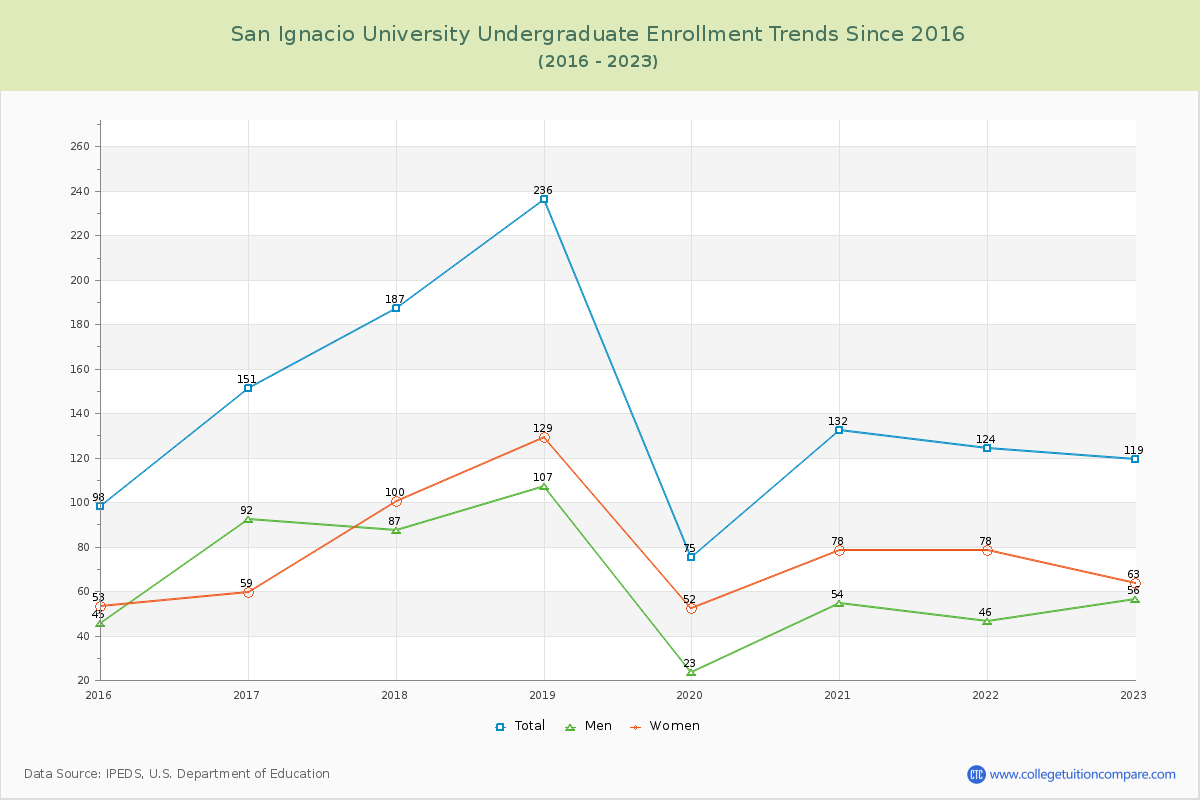
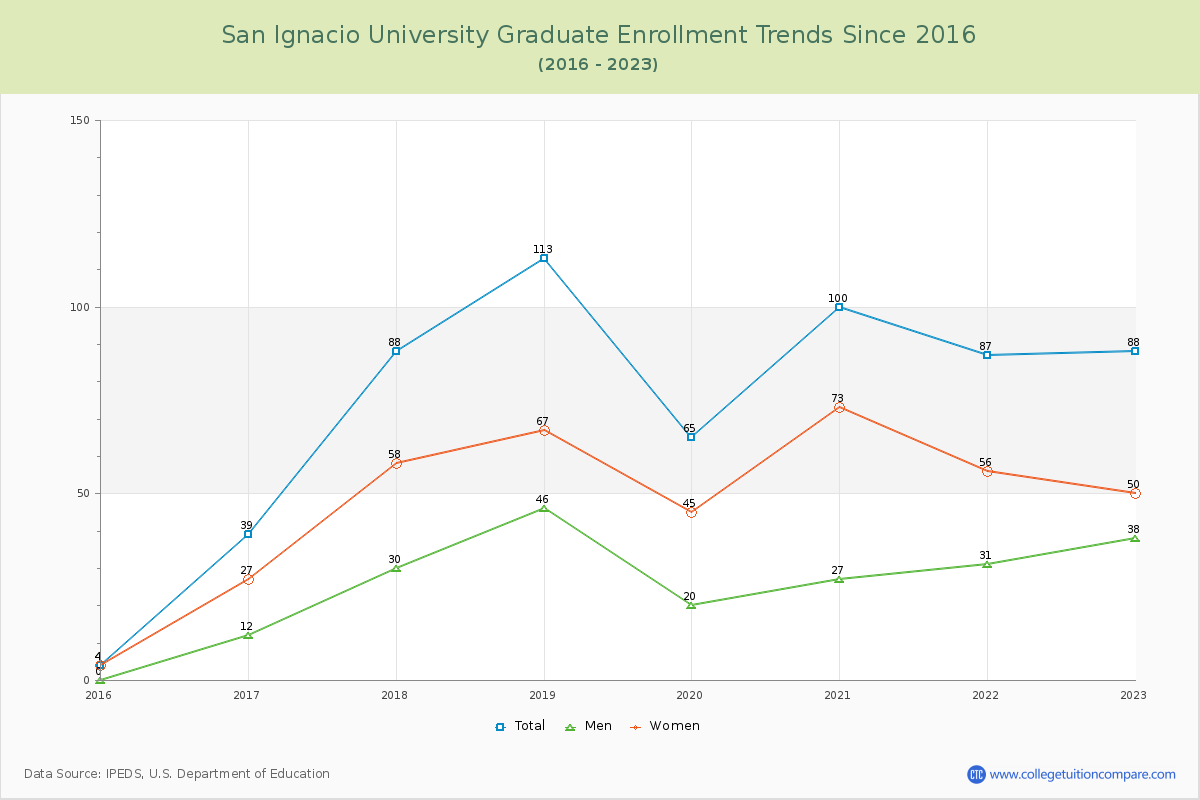
57.49% of total students is undergraduate students and 42.51% students is graduate students. The number of undergraduate students has increased by 21 and the graduate enrollment has increased by 84 over past 10 years.
The female to male ratio is 1.20 to 1 and it means that there are slightly more female students enrolled in San Ignacio than male students.
The following table and chart illustrate the changes in student population by gender at San Ignacio University since 2015.
| Year | Total | Undergraduate | Graduate | ||||
|---|---|---|---|---|---|---|---|
| Total | Men | Women | Total | Men | Women | ||
| 2015-16 | 102 | 98 | 45 | 53 | 4 | 0 | 4 |
| 2016-17 | 190 88 | 151 53 | 92 47 | 59 6 | 39 35 | 12 12 | 27 23 |
| 2017-18 | 275 85 | 187 36 | 87 -5 | 100 41 | 88 49 | 30 18 | 58 31 |
| 2018-19 | 349 74 | 236 49 | 107 20 | 129 29 | 113 25 | 46 16 | 67 9 |
| 2019-20 | 140 -209 | 75 -161 | 23 -84 | 52 -77 | 65 -48 | 20 -26 | 45 -22 |
| 2020-21 | 232 92 | 132 57 | 54 31 | 78 26 | 100 35 | 27 7 | 73 28 |
| 2021-22 | 211 -21 | 124 -8 | 46 -8 | 78 0 | 87 -13 | 31 4 | 56 -17 |
| 2022-23 | 207 -4 | 119 -5 | 56 10 | 63 -15 | 88 1 | 38 7 | 50 -6 |
| Average | 213 | 140 | 64 | 77 | 73 | 26 | 48 |