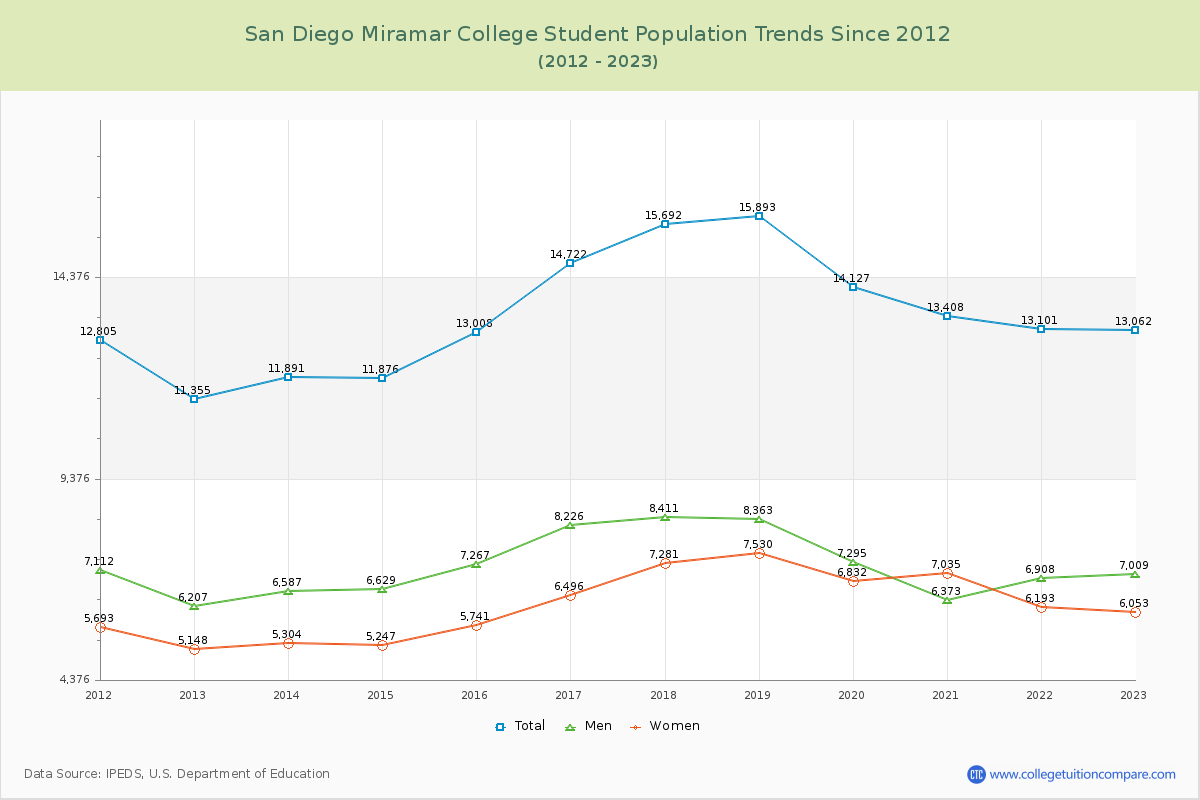
Student Population Changes
The average student population over the last 12 years is 13,467 where 13,062 students are attending the school for the academic year 2022-2023.
The female to male ratio is 0.86 to 1 and it means that there are slightly more male students enrolled in San Diego Miramar than female students.
The following table and chart illustrate the changes in student population by gender at San Diego Miramar College since 2012.
| Year | Total | Men | Women |
|---|---|---|---|
| 2012-13 | 11,355 | 6,207 | 5,148 |
| 2013-14 | 11,891 536 | 6,587 380 | 5,304 156 |
| 2014-15 | 11,876 -15 | 6,629 42 | 5,247 -57 |
| 2015-16 | 13,008 1,132 | 7,267 638 | 5,741 494 |
| 2016-17 | 14,722 1,714 | 8,226 959 | 6,496 755 |
| 2017-18 | 15,692 970 | 8,411 185 | 7,281 785 |
| 2018-19 | 15,893 201 | 8,363 -48 | 7,530 249 |
| 2019-20 | 14,127 -1,766 | 7,295 -1,068 | 6,832 -698 |
| 2020-21 | 13,408 -719 | 6,373 -922 | 7,035 203 |
| 2021-22 | 13,101 -307 | 6,908 535 | 6,193 -842 |
| 2022-23 | 13,062 -39 | 7,009 101 | 6,053 -140 |
| Average | 13,467 | 7,207 | 6,260 |