Enrollment Trends at San Diego City

-3,278

Total Enrollment

-1,732

Men

-1,546

Women

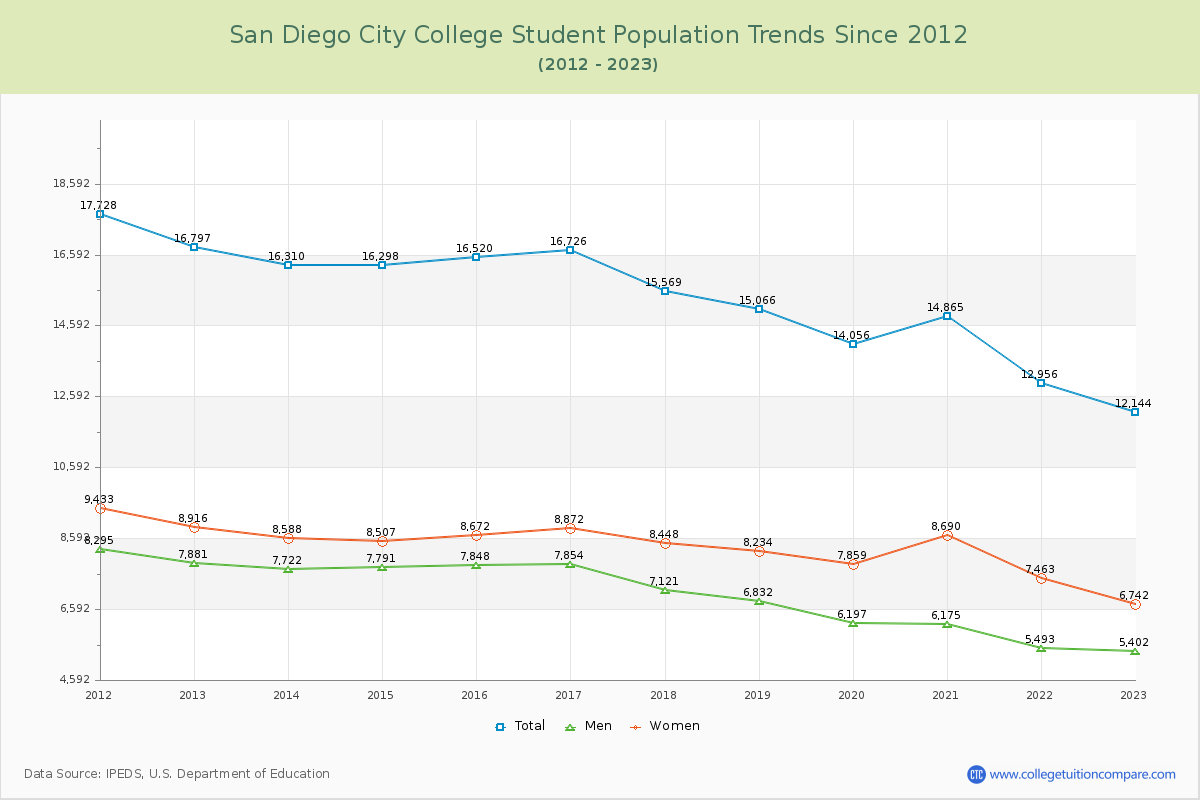
The student population at San Diego City College is 13,242 (all undergraduate). The number of students has decreased by 3,278 over the past decade.

The female to male ratio is 1.17 to 1 which means that female students enrolled slightly more than male students.

4,533 students enrolled in online degree program exclusively and the number of online students has increased by 94.88% since 2015.

Student Population Changes

The average student population over the last 11 years is 14,434 where 13,242 students are attending the school for the academic year 2024-2025.

The female to male ratio is 1.17 to 1 and it means that there are slightly more female students enrolled in San Diego City than male students.

The following table and chart illustrate the changes in student population by gender at San Diego City College since 2015.

YearTotalMenWomen
2015-1616,5207,8488,672
2016-1716,726
206
7,854
6
8,872
200
2017-1815,569
-1,157
7,121
-733
8,448
-424
2018-1915,066
-503
6,832
-289
8,234
-214
2019-2014,056
-1,010
6,197
-635
7,859
-375
2020-2114,865
809
6,175
-22
8,690
831
2021-2212,956
-1,909
5,493
-682
7,463
-1,227
2022-2312,144
-812
5,402
-91
6,742
-721
2023-2413,197
1,053
6,060
658
7,137
395
2024-2513,242
45
6,116
56
7,126
-11
Average14,4346,5107,924
San Diego City College Enrollment Trends Chart

Enrollment by Race/Ethnicity Changes

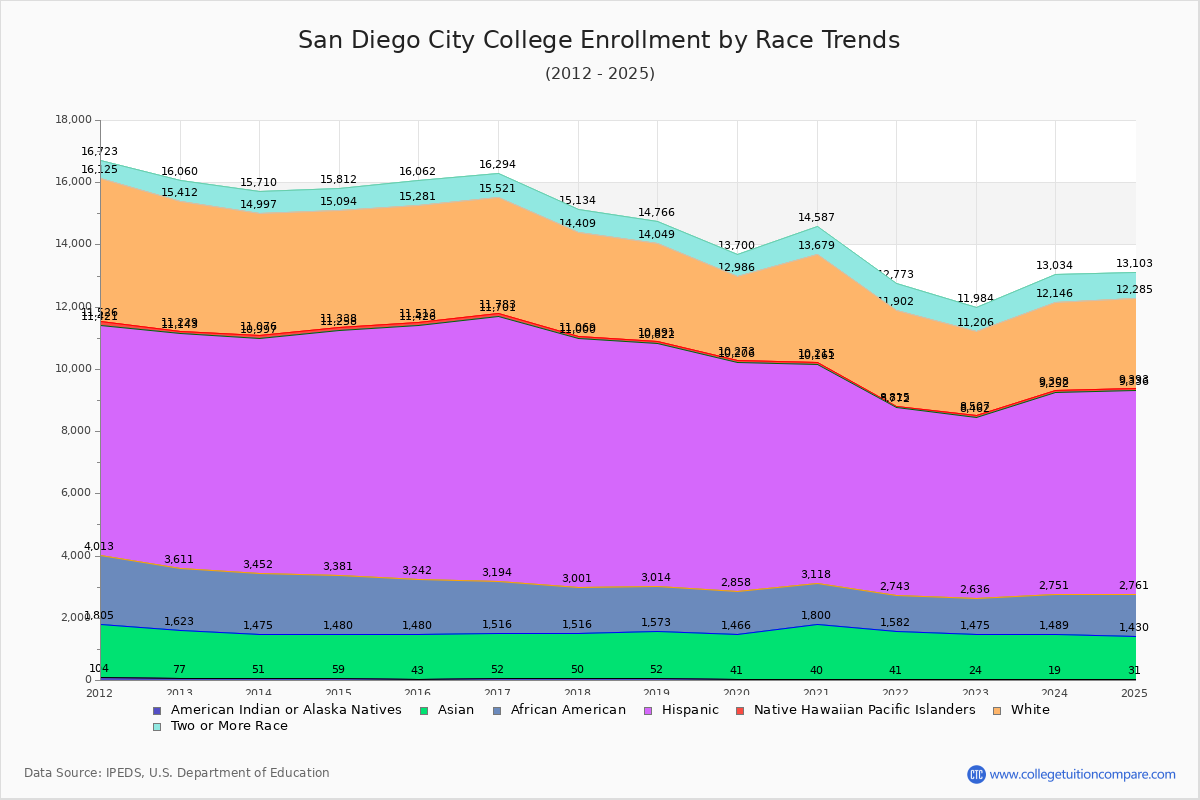
The percentage of white students is 21.84% and the percentage of black students is 10.05% at San Diego City College. 10.56% of enrolled students is Asian. Hispanic students comprise 49.65% of the student body.

Over the past 10 years, the racial composition has shifted. The percentage of white students decreased from 22.81% to 21.84%. Asian enrollment grew from 8.70% to 10.56%. Black student enrollment decreased from 10.67% to 10.05%. Hispanic student representation expanded from 49.54% to 49.65%.

The overall racial diversity, measured by the Census Bureau Diversity Index, is 0.6807 which indicates that moderately diverse. This decreased from 0.6813 a decade ago, suggesting that racial diversity has declined.

The following table and chart illustrate the student population trends by race/ethnicity at San Diego City College over the past 11 years (2015-2025).

YearAmerican Indian or Native AmericanAsianBlackHispanicNative Hawaiian or Other Pacific IslanderWhiteTwo or More Races
2015-16431,4371,7628,184873,768781
2016-17521,4641,6788,507823,738773
2017-18501,4661,4857,999693,340725
2018-19521,5211,4417,808693,158717
2019-20411,4251,3927,348672,713714
2020-21401,7601,3187,043543,464908
2021-22411,5411,1616,029433,087871
2022-23241,4511,1615,826452,699778
2023-24191,4701,2626,501562,838888
2024-25311,3991,3316,575572,892818
Average391,4931,3997,182633,170797
San Diego City College Enrollment by Race Trends Chart

Distance Learning (Online Courses) Enrollment Changes

4,533 students are enrolled in online degree programs exclusively for the academic year 2024-2025, which is 34% of total students. The number of online students has increased 94.88% since 2015. The following table and chart illustrate the changes in the online student population by enrolled type at San Diego City College from 2015 to 2025.

YearTotal EnrollmentOnline CompletelyEnrolled in Some Online CoursesNot Enrolled in Online Courses
2015-1616,5202,3262,16612,028
2016-1716,7262,6762,19811,852
2017-1815,5692,8372,04810,684
2018-1915,0663,0022,2269,838
2019-2014,0562,4272,1769,453
2020-2114,86514,63682147
2021-2212,95611,602866488
2022-2312,1445,9012,3653,878
2023-2413,1975,0372,6585,502
2024-2513,2424,5332,4166,293
Average14,4345,4981,9207,016

Ratings & Review

Share your experiences and thoughts about San Diego City College. It will be a great help to applicants and prospective students!