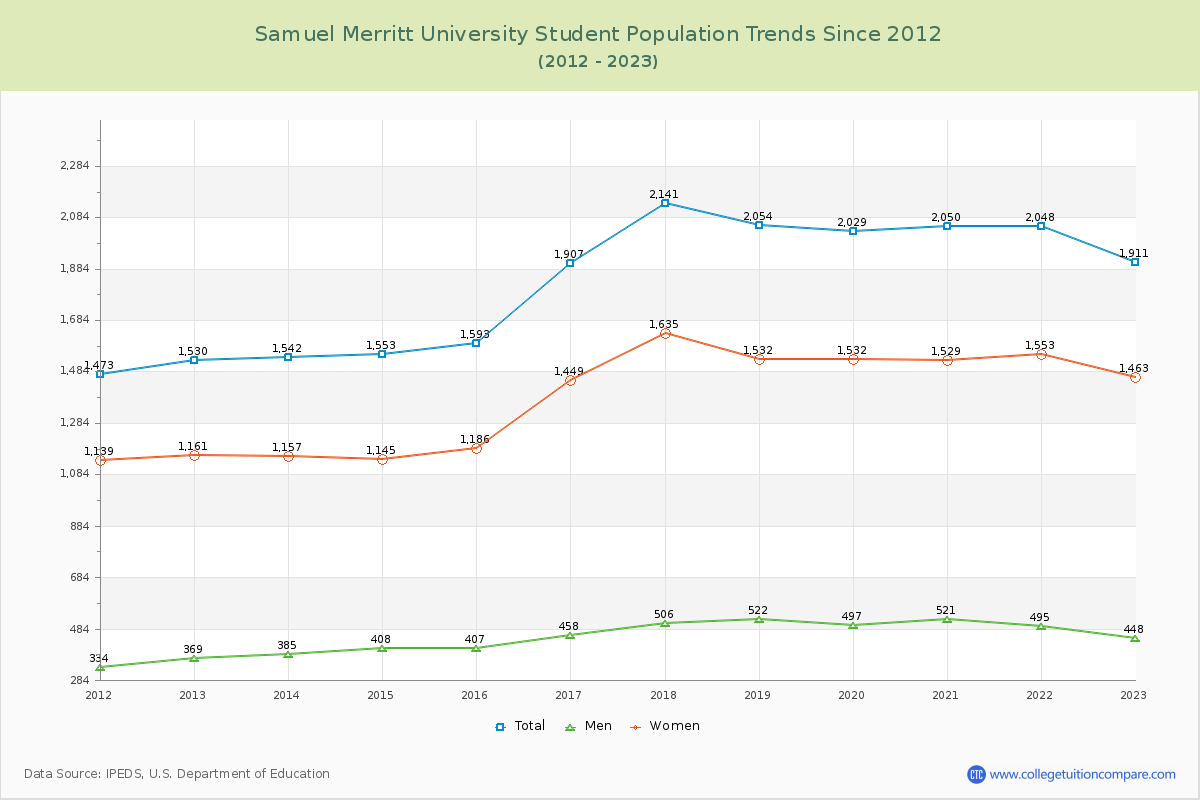
Student Population Changes
The average student population over the last 12 years is 1,851 where 1,911 students are attending the school for the academic year 2022-2023.
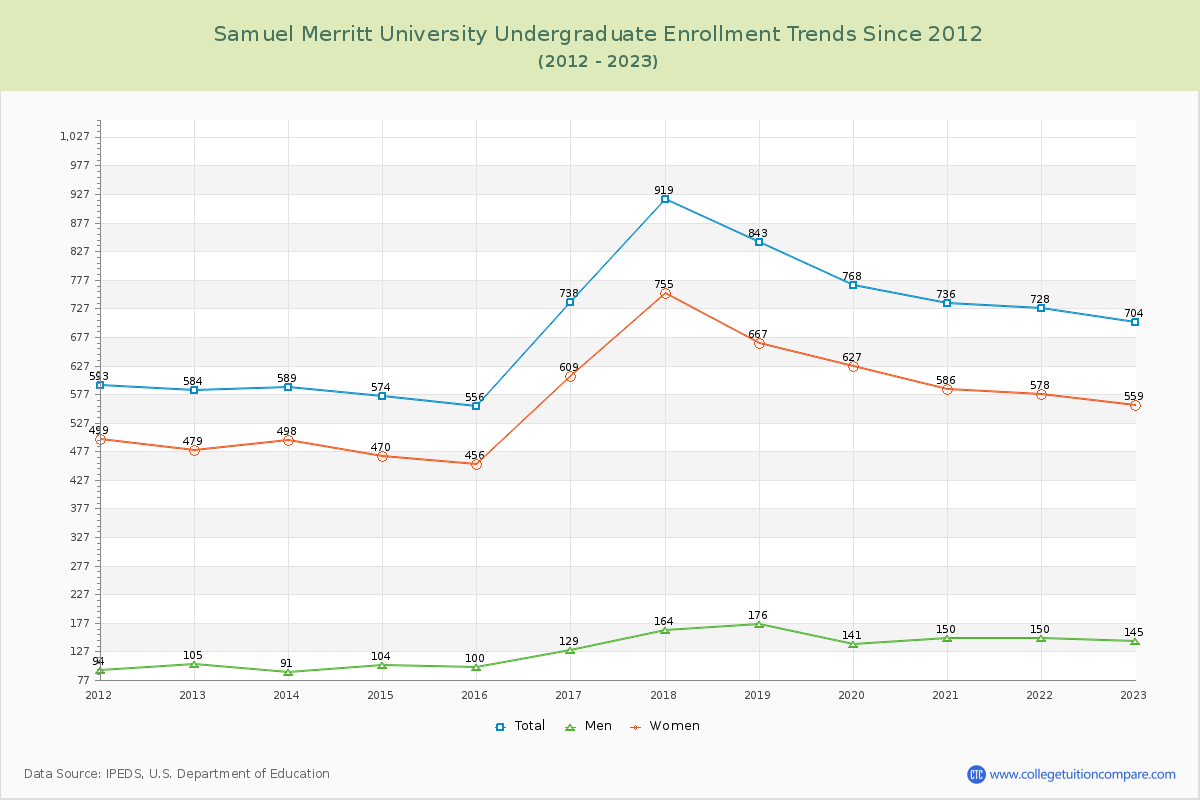
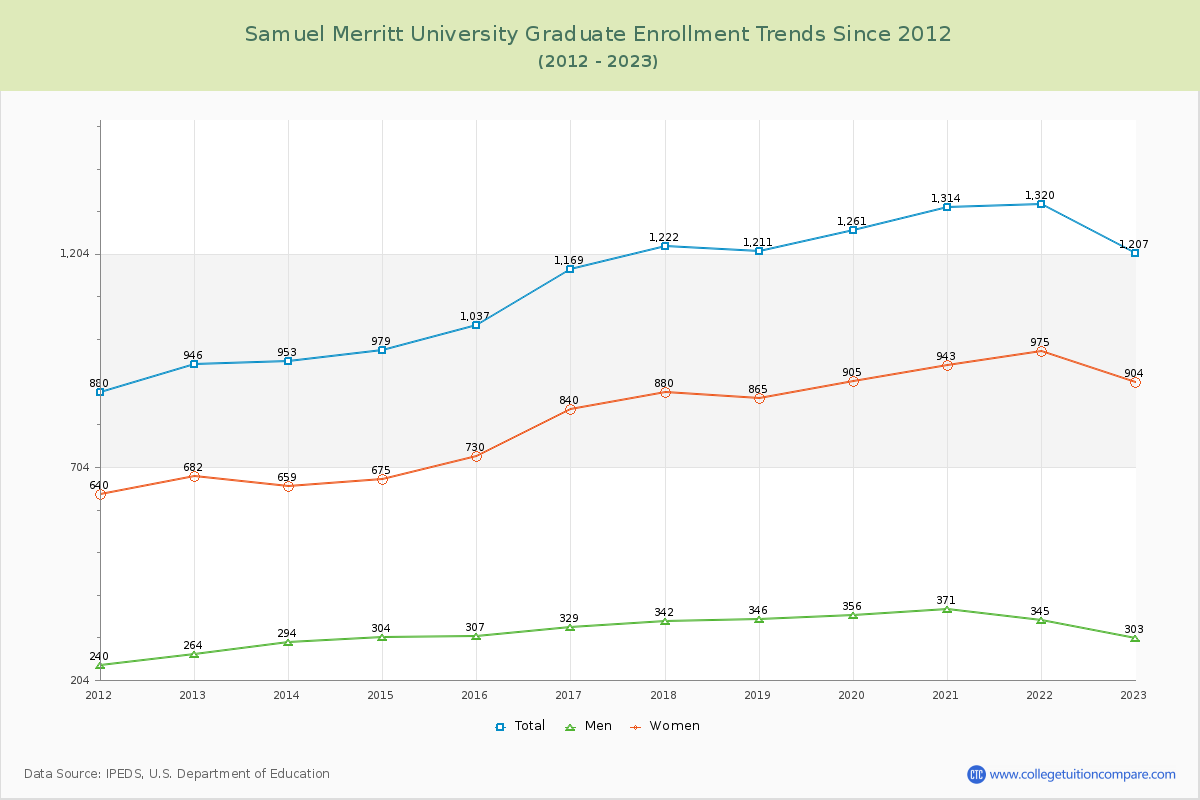
36.84% of total students is undergraduate students and 63.16% students is graduate students. The number of undergraduate students has increased by 120 and the graduate enrollment has increased by 261 over past 10 years.
The female to male ratio is 3.27 to 1 and it means that there are far more female students enrolled in Samuel Merritt than male students.
The following table and chart illustrate the changes in student population by gender at Samuel Merritt University since 2012.
| Year | Total | Undergraduate | Graduate | ||||
|---|---|---|---|---|---|---|---|
| Total | Men | Women | Total | Men | Women | ||
| 2012-13 | 1,530 | 584 | 105 | 479 | 946 | 264 | 682 |
| 2013-14 | 1,542 12 | 589 5 | 91 -14 | 498 19 | 953 7 | 294 30 | 659 -23 |
| 2014-15 | 1,553 11 | 574 -15 | 104 13 | 470 -28 | 979 26 | 304 10 | 675 16 |
| 2015-16 | 1,593 40 | 556 -18 | 100 -4 | 456 -14 | 1,037 58 | 307 3 | 730 55 |
| 2016-17 | 1,907 314 | 738 182 | 129 29 | 609 153 | 1,169 132 | 329 22 | 840 110 |
| 2017-18 | 2,141 234 | 919 181 | 164 35 | 755 146 | 1,222 53 | 342 13 | 880 40 |
| 2018-19 | 2,054 -87 | 843 -76 | 176 12 | 667 -88 | 1,211 -11 | 346 4 | 865 -15 |
| 2019-20 | 2,029 -25 | 768 -75 | 141 -35 | 627 -40 | 1,261 50 | 356 10 | 905 40 |
| 2020-21 | 2,050 21 | 736 -32 | 150 9 | 586 -41 | 1,314 53 | 371 15 | 943 38 |
| 2021-22 | 2,048 -2 | 728 -8 | 150 0 | 578 -8 | 1,320 6 | 345 -26 | 975 32 |
| 2022-23 | 1,911 -137 | 704 -24 | 145 -5 | 559 -19 | 1,207 -113 | 303 -42 | 904 -71 |
| Average | 1,851 | 704 | 132 | 571 | 1,147 | 324 | 823 |