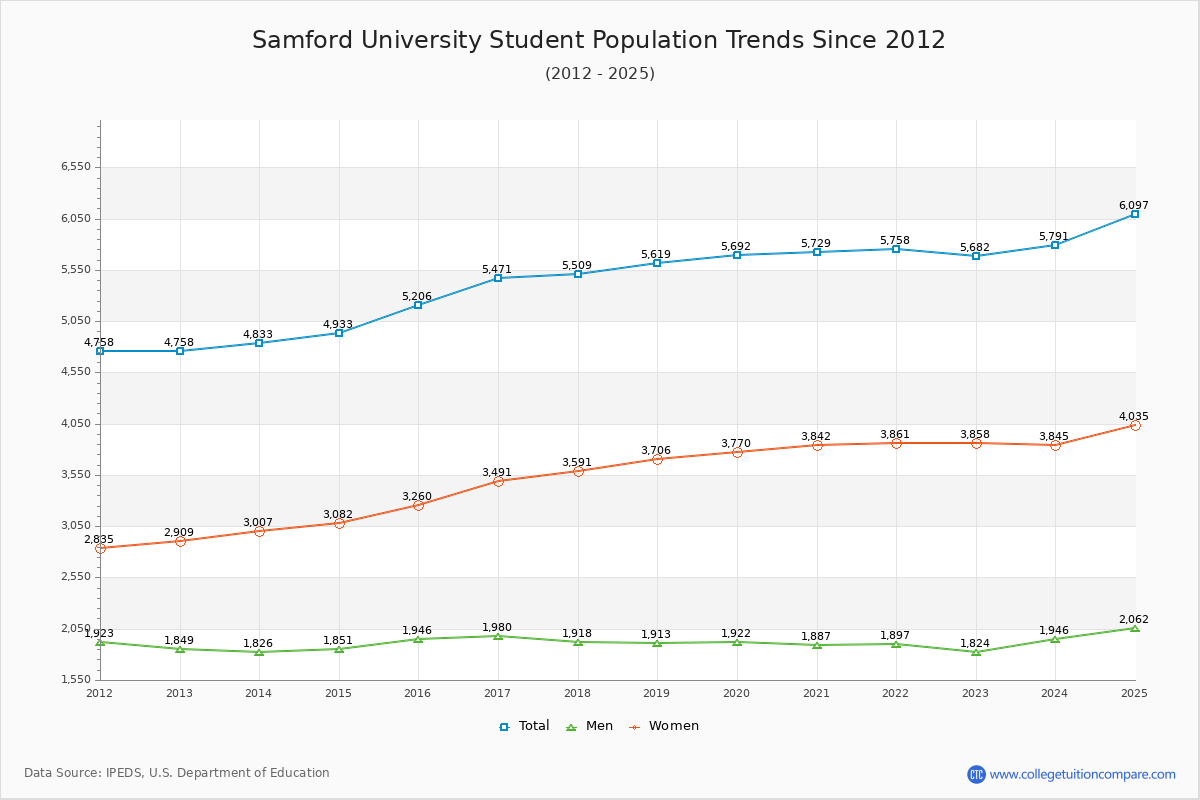
Student Population Changes
The average student population over the last 12 years is 5,381 where 5,682 students are attending the school for the academic year 2022-2023.
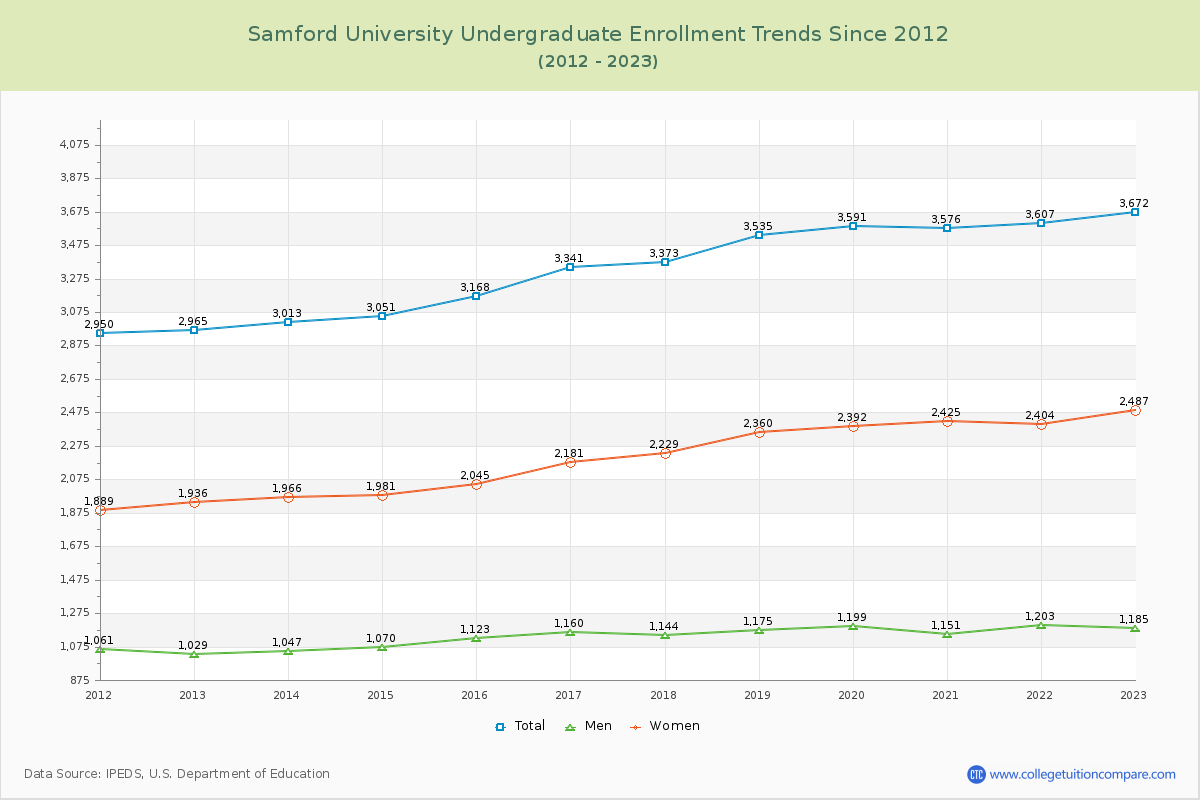
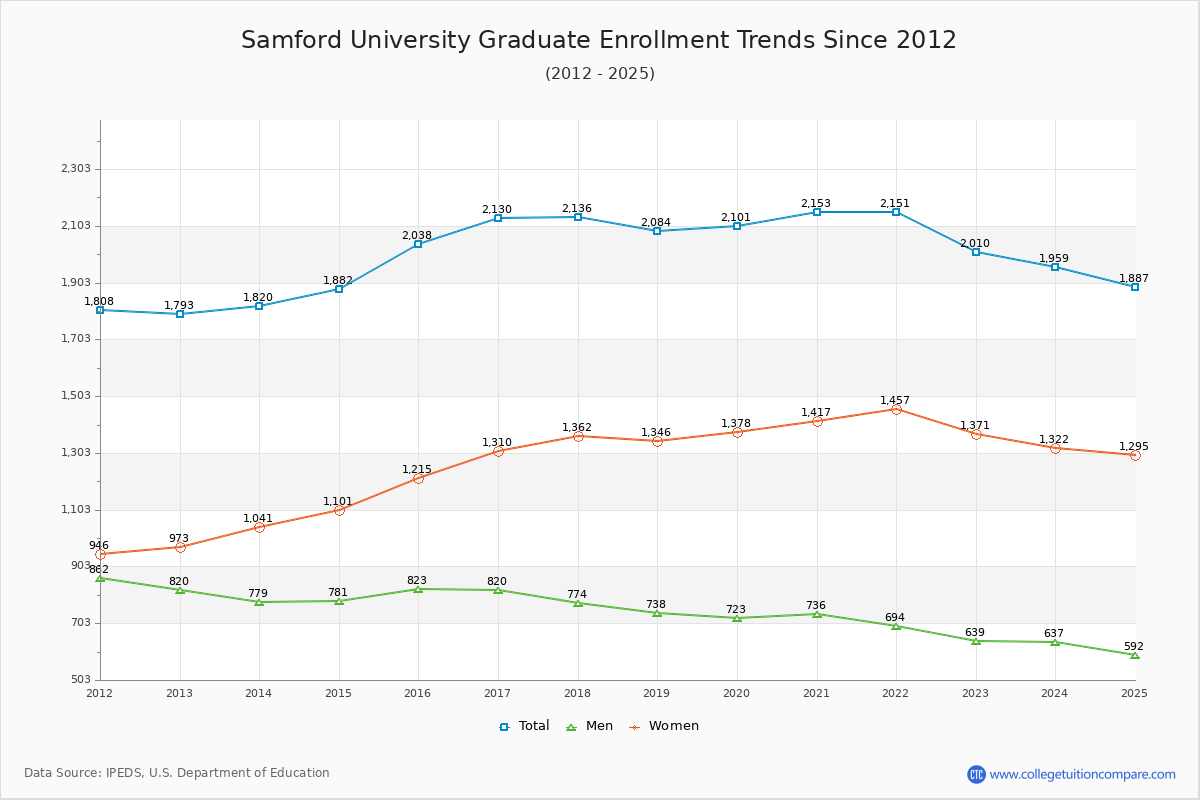
64.63% of total students is undergraduate students and 35.37% students is graduate students. The number of undergraduate students has increased by 707 and the graduate enrollment has increased by 217 over past 10 years.
The female to male ratio is 2.12 to 1 and it means that there are far more female students enrolled in Samford than male students.
The following table and chart illustrate the changes in student population by gender at Samford University since 2012.
| Year | Total | Undergraduate | Graduate | ||||
|---|---|---|---|---|---|---|---|
| Total | Men | Women | Total | Men | Women | ||
| 2012-13 | 4,758 | 2,965 | 1,029 | 1,936 | 1,793 | 820 | 973 |
| 2013-14 | 4,833 75 | 3,013 48 | 1,047 18 | 1,966 30 | 1,820 27 | 779 -41 | 1,041 68 |
| 2014-15 | 4,933 100 | 3,051 38 | 1,070 23 | 1,981 15 | 1,882 62 | 781 2 | 1,101 60 |
| 2015-16 | 5,206 273 | 3,168 117 | 1,123 53 | 2,045 64 | 2,038 156 | 823 42 | 1,215 114 |
| 2016-17 | 5,471 265 | 3,341 173 | 1,160 37 | 2,181 136 | 2,130 92 | 820 -3 | 1,310 95 |
| 2017-18 | 5,509 38 | 3,373 32 | 1,144 -16 | 2,229 48 | 2,136 6 | 774 -46 | 1,362 52 |
| 2018-19 | 5,619 110 | 3,535 162 | 1,175 31 | 2,360 131 | 2,084 -52 | 738 -36 | 1,346 -16 |
| 2019-20 | 5,692 73 | 3,591 56 | 1,199 24 | 2,392 32 | 2,101 17 | 723 -15 | 1,378 32 |
| 2020-21 | 5,729 37 | 3,576 -15 | 1,151 -48 | 2,425 33 | 2,153 52 | 736 13 | 1,417 39 |
| 2021-22 | 5,758 29 | 3,607 31 | 1,203 52 | 2,404 -21 | 2,151 -2 | 694 -42 | 1,457 40 |
| 2022-23 | 5,682 -76 | 3,672 65 | 1,185 -18 | 2,487 83 | 2,010 -141 | 639 -55 | 1,371 -86 |
| Average | 5,381 | 3,354 | 1,135 | 2,219 | 2,027 | 757 | 1,270 |