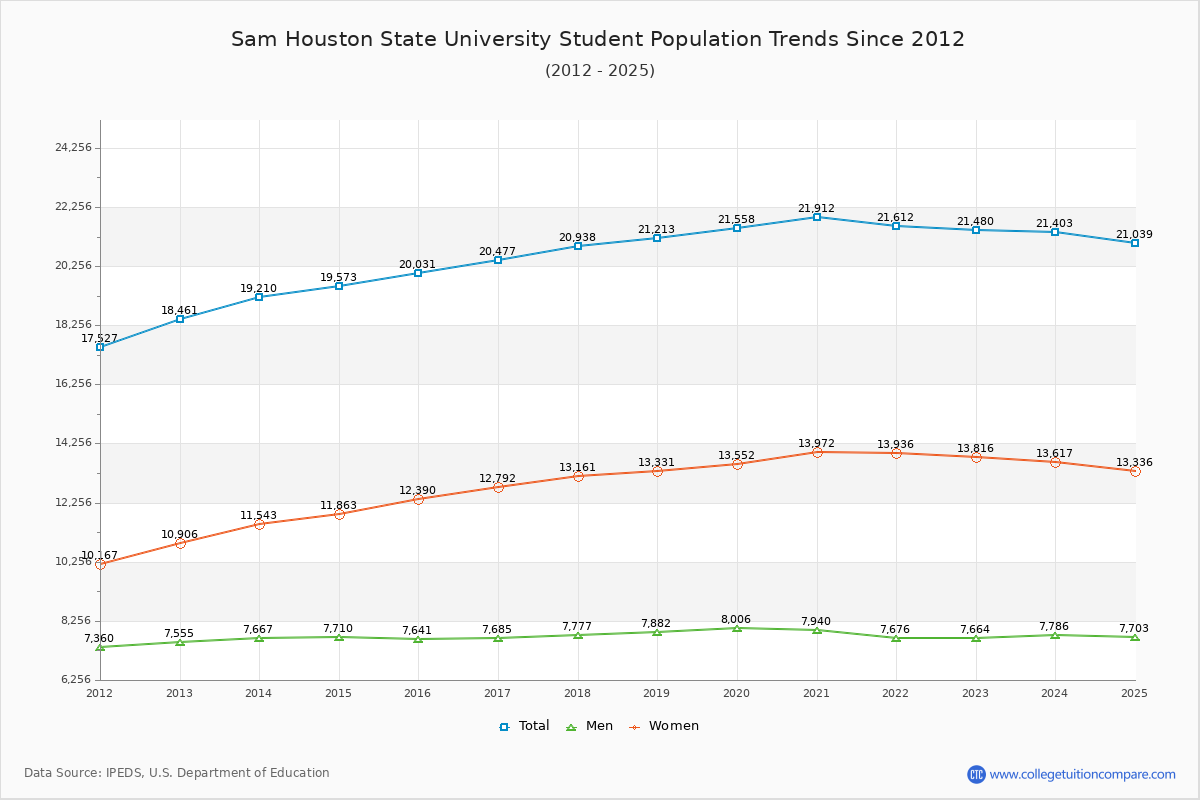
Student Population Changes
The average student population over the last 12 years is 20,588 where 21,480 students are attending the school for the academic year 2022-2023.
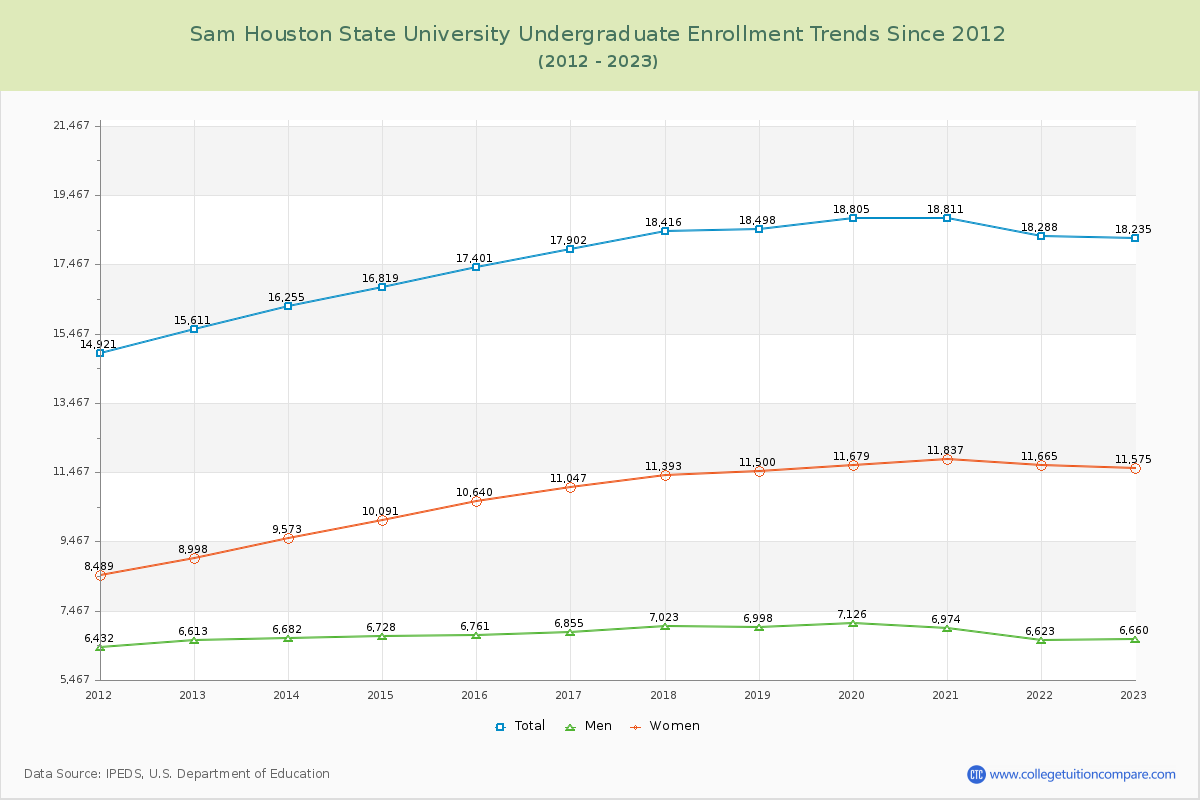
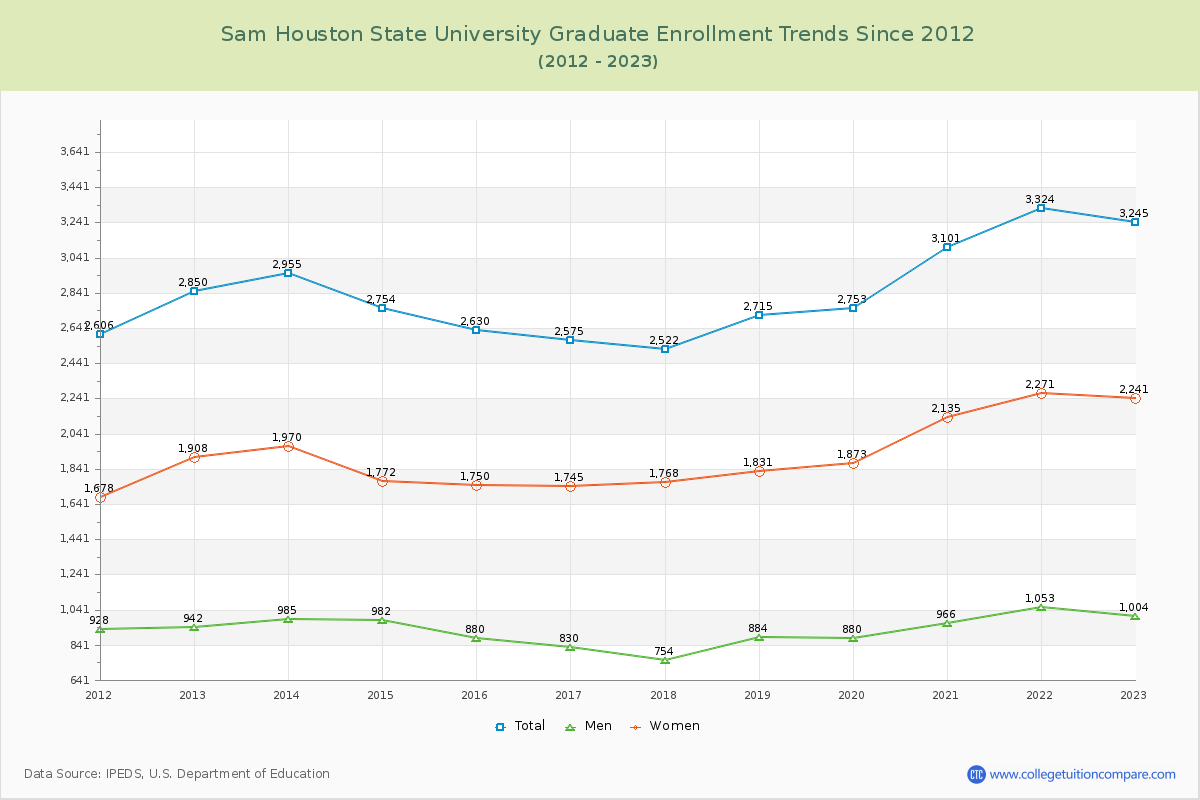
84.89% of total students is undergraduate students and 15.11% students is graduate students. The number of undergraduate students has increased by 2,624 and the graduate enrollment has increased by 395 over past 10 years.
The female to male ratio is 1.80 to 1 and it means that there are more female students enrolled in Sam Houston State than male students.
The following table and chart illustrate the changes in student population by gender at Sam Houston State University since 2012.
| Year | Total | Undergraduate | Graduate | ||||
|---|---|---|---|---|---|---|---|
| Total | Men | Women | Total | Men | Women | ||
| 2012-13 | 18,461 | 15,611 | 6,613 | 8,998 | 2,850 | 942 | 1,908 |
| 2013-14 | 19,210 749 | 16,255 644 | 6,682 69 | 9,573 575 | 2,955 105 | 985 43 | 1,970 62 |
| 2014-15 | 19,573 363 | 16,819 564 | 6,728 46 | 10,091 518 | 2,754 -201 | 982 -3 | 1,772 -198 |
| 2015-16 | 20,031 458 | 17,401 582 | 6,761 33 | 10,640 549 | 2,630 -124 | 880 -102 | 1,750 -22 |
| 2016-17 | 20,477 446 | 17,902 501 | 6,855 94 | 11,047 407 | 2,575 -55 | 830 -50 | 1,745 -5 |
| 2017-18 | 20,938 461 | 18,416 514 | 7,023 168 | 11,393 346 | 2,522 -53 | 754 -76 | 1,768 23 |
| 2018-19 | 21,213 275 | 18,498 82 | 6,998 -25 | 11,500 107 | 2,715 193 | 884 130 | 1,831 63 |
| 2019-20 | 21,558 345 | 18,805 307 | 7,126 128 | 11,679 179 | 2,753 38 | 880 -4 | 1,873 42 |
| 2020-21 | 21,912 354 | 18,811 6 | 6,974 -152 | 11,837 158 | 3,101 348 | 966 86 | 2,135 262 |
| 2021-22 | 21,612 -300 | 18,288 -523 | 6,623 -351 | 11,665 -172 | 3,324 223 | 1,053 87 | 2,271 136 |
| 2022-23 | 21,480 -132 | 18,235 -53 | 6,660 37 | 11,575 -90 | 3,245 -79 | 1,004 -49 | 2,241 -30 |
| Average | 20,588 | 17,731 | 6,822 | 10,909 | 2,857 | 924 | 1,933 |