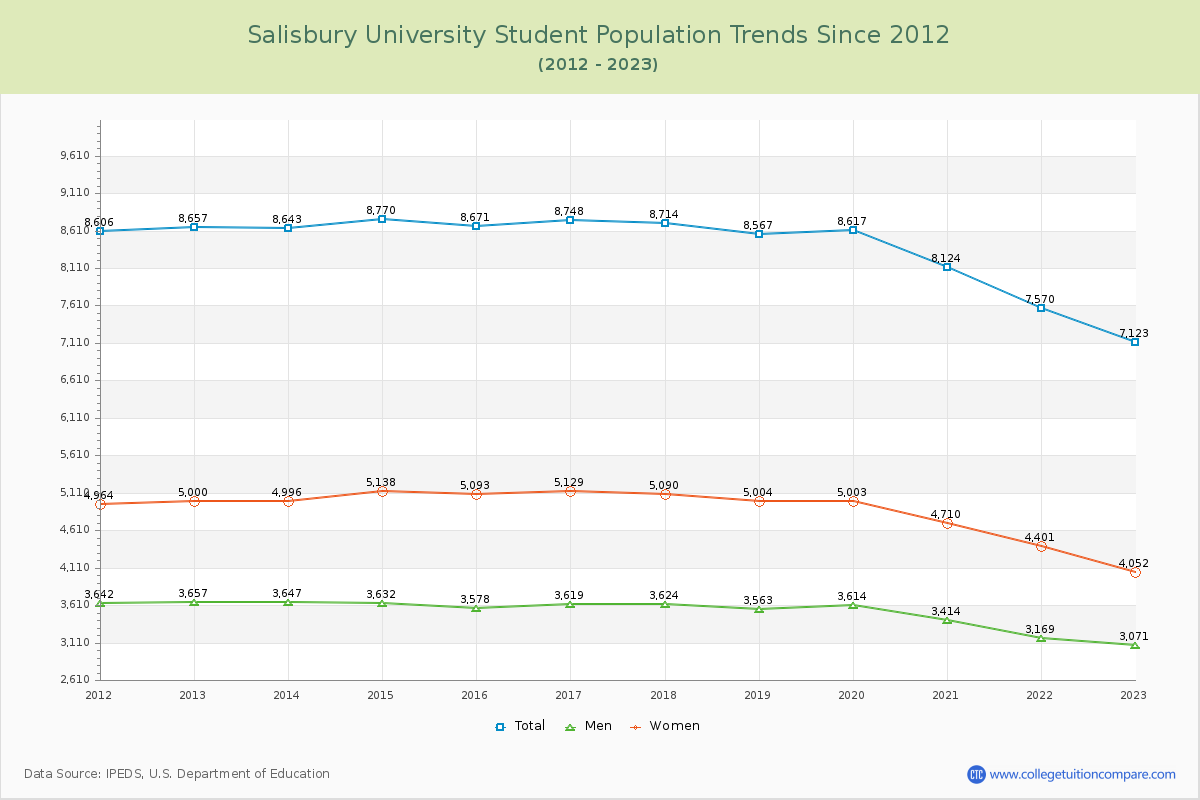
Student Population Changes
The average student population over the last 12 years is 8,382 where 7,123 students are attending the school for the academic year 2022-2023.
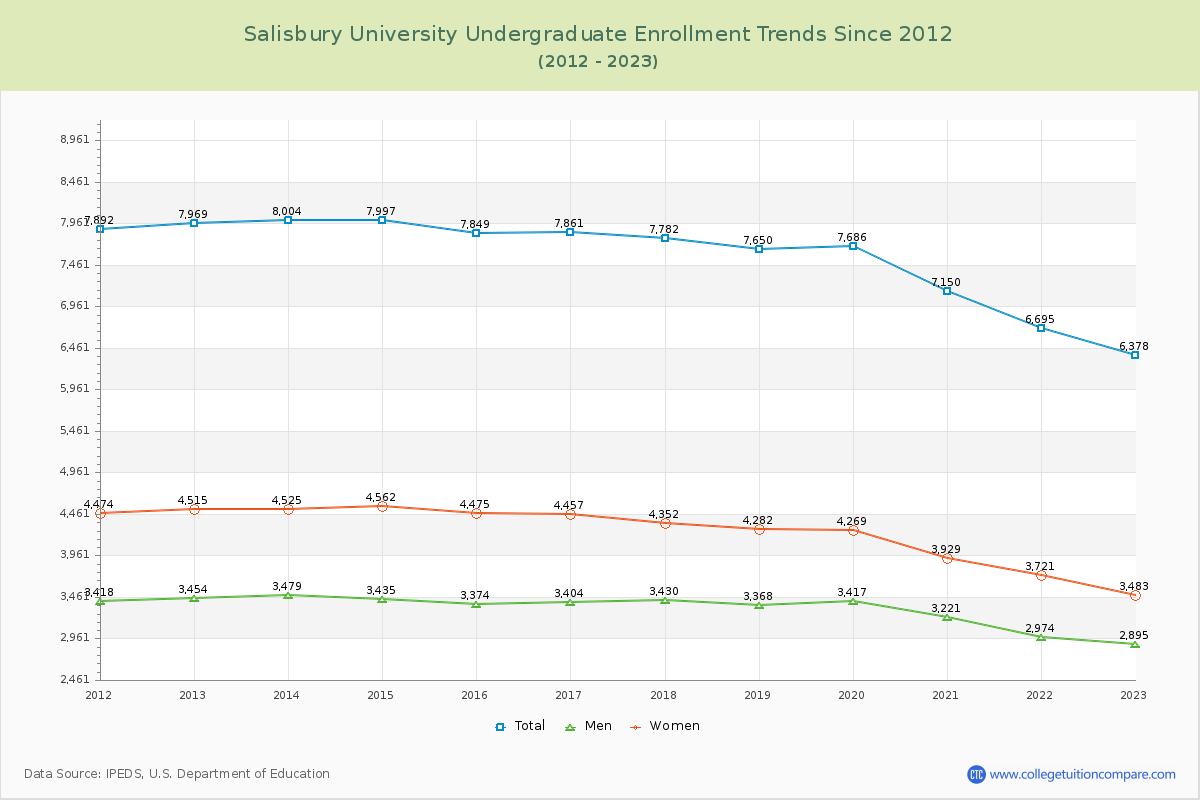
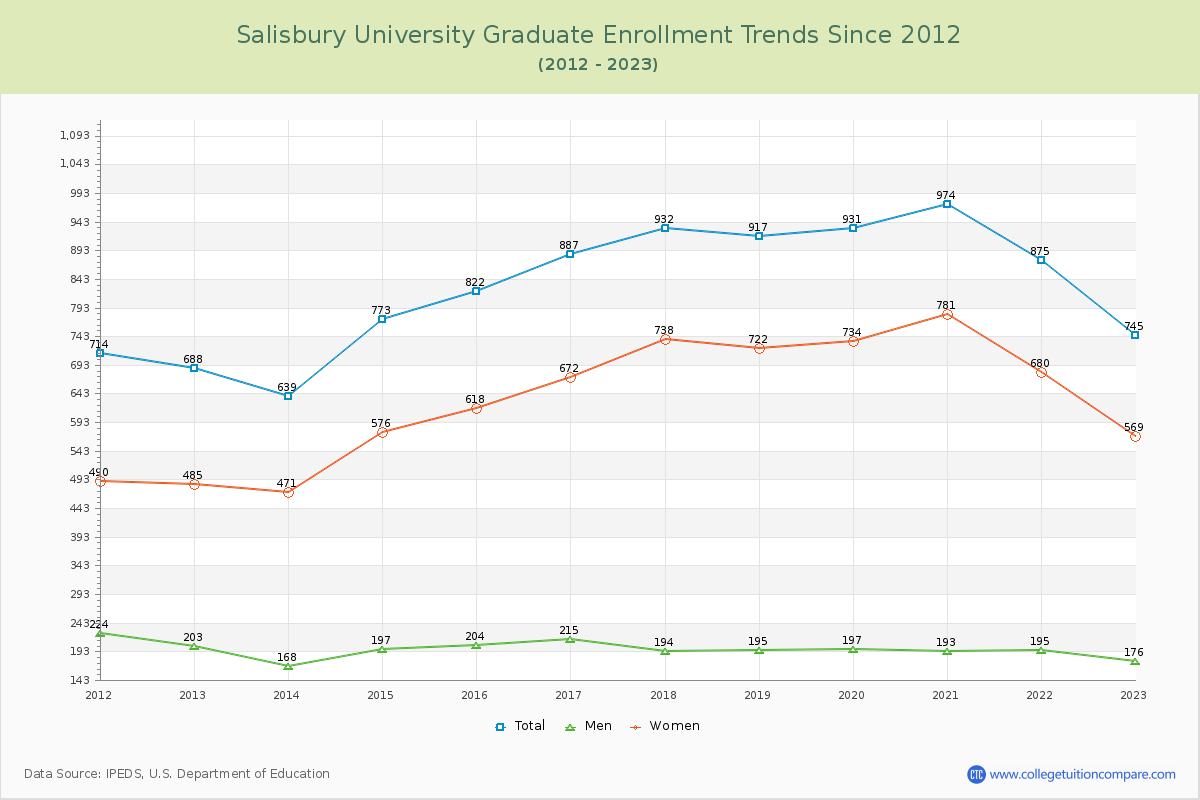
89.54% of total students is undergraduate students and 10.46% students is graduate students. The number of undergraduate students has decreased by 1,591 and the graduate enrollment has increased by 57 over past 10 years.
The female to male ratio is 1.32 to 1 and it means that there are more female students enrolled in SU than male students.
The following table and chart illustrate the changes in student population by gender at Salisbury University since 2012.
| Year | Total | Undergraduate | Graduate | ||||
|---|---|---|---|---|---|---|---|
| Total | Men | Women | Total | Men | Women | ||
| 2012-13 | 8,657 | 7,969 | 3,454 | 4,515 | 688 | 203 | 485 |
| 2013-14 | 8,643 -14 | 8,004 35 | 3,479 25 | 4,525 10 | 639 -49 | 168 -35 | 471 -14 |
| 2014-15 | 8,770 127 | 7,997 -7 | 3,435 -44 | 4,562 37 | 773 134 | 197 29 | 576 105 |
| 2015-16 | 8,671 -99 | 7,849 -148 | 3,374 -61 | 4,475 -87 | 822 49 | 204 7 | 618 42 |
| 2016-17 | 8,748 77 | 7,861 12 | 3,404 30 | 4,457 -18 | 887 65 | 215 11 | 672 54 |
| 2017-18 | 8,714 -34 | 7,782 -79 | 3,430 26 | 4,352 -105 | 932 45 | 194 -21 | 738 66 |
| 2018-19 | 8,567 -147 | 7,650 -132 | 3,368 -62 | 4,282 -70 | 917 -15 | 195 1 | 722 -16 |
| 2019-20 | 8,617 50 | 7,686 36 | 3,417 49 | 4,269 -13 | 931 14 | 197 2 | 734 12 |
| 2020-21 | 8,124 -493 | 7,150 -536 | 3,221 -196 | 3,929 -340 | 974 43 | 193 -4 | 781 47 |
| 2021-22 | 7,570 -554 | 6,695 -455 | 2,974 -247 | 3,721 -208 | 875 -99 | 195 2 | 680 -101 |
| 2022-23 | 7,123 -447 | 6,378 -317 | 2,895 -79 | 3,483 -238 | 745 -130 | 176 -19 | 569 -111 |
| Average | 8,382 | 7,547 | 3,314 | 4,234 | 835 | 194 | 641 |