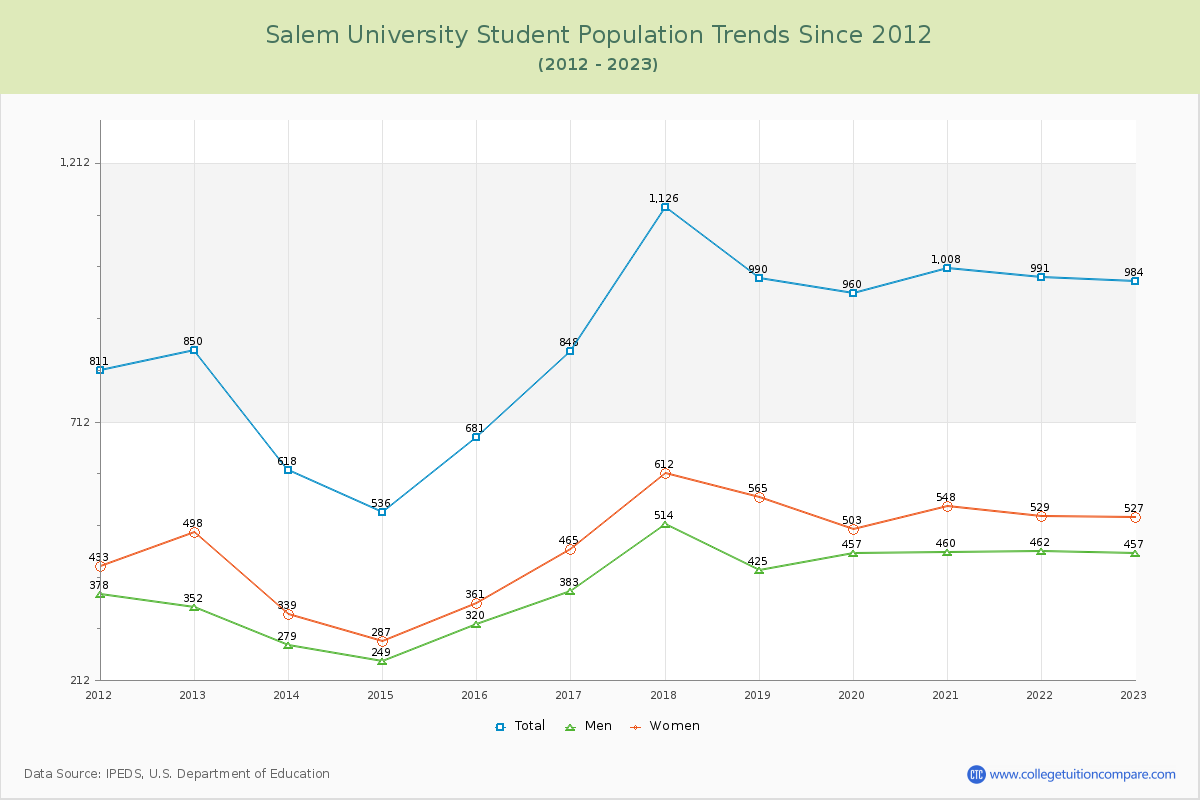
Student Population Changes
The average student population over the last 12 years is 872 where 984 students are attending the school for the academic year 2022-2023.
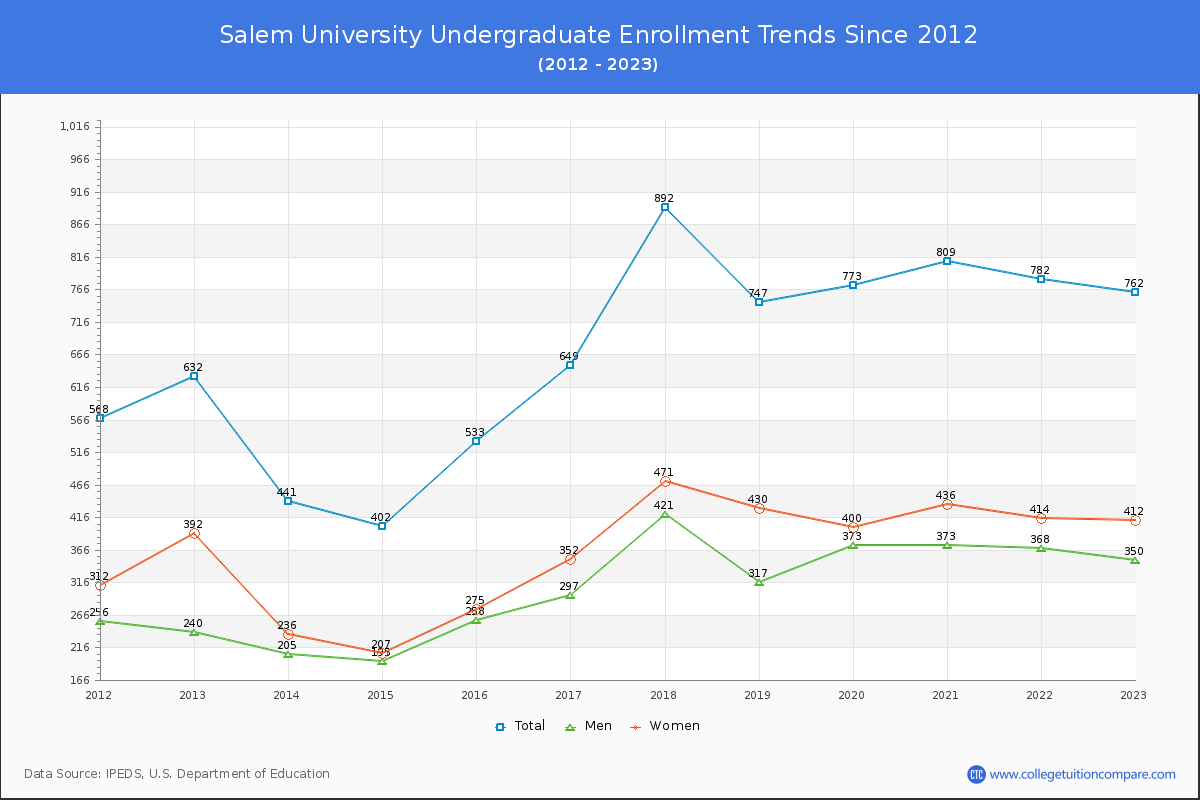
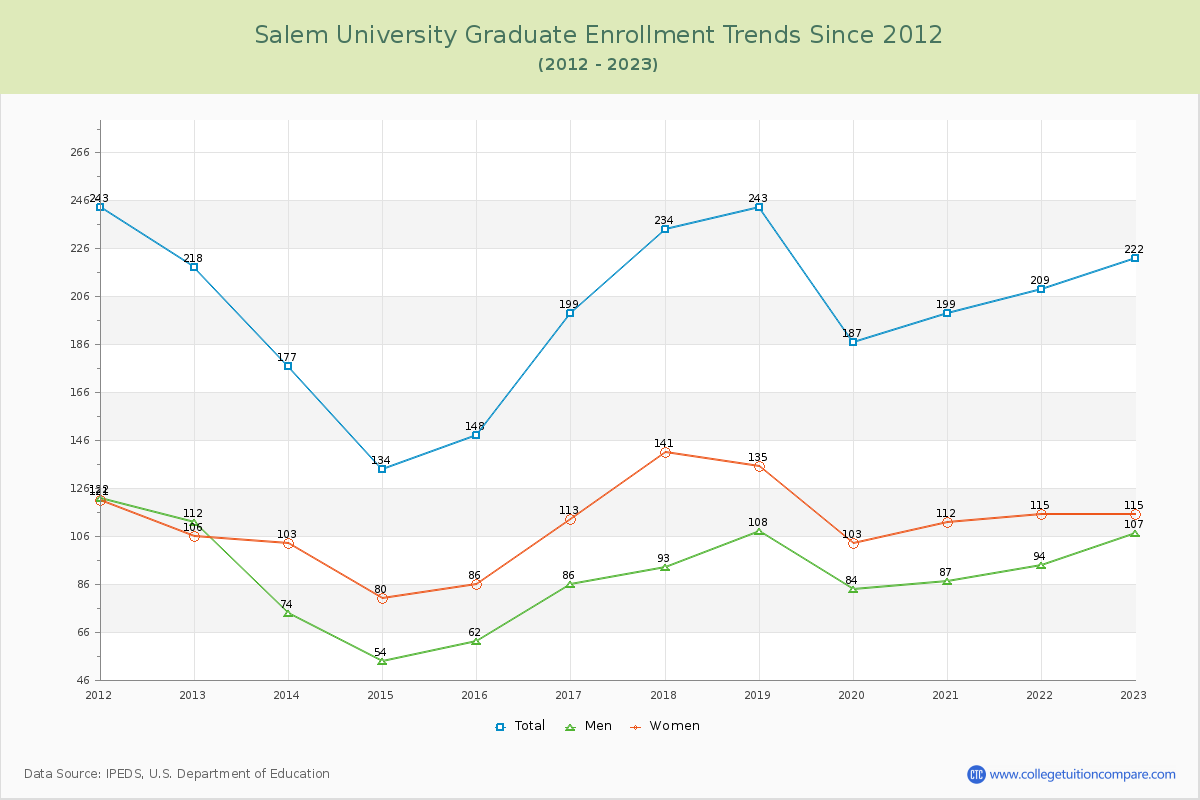
77.44% of total students is undergraduate students and 22.56% students is graduate students. The number of undergraduate students has increased by 130 and the graduate enrollment has increased by 4 over past 10 years.
The female to male ratio is 1.15 to 1 and it means that there are slightly more female students enrolled in Salem than male students.
The following table and chart illustrate the changes in student population by gender at Salem University since 2012.
| Year | Total | Undergraduate | Graduate | ||||
|---|---|---|---|---|---|---|---|
| Total | Men | Women | Total | Men | Women | ||
| 2012-13 | 850 | 632 | 240 | 392 | 218 | 112 | 106 |
| 2013-14 | 618 -232 | 441 -191 | 205 -35 | 236 -156 | 177 -41 | 74 -38 | 103 -3 |
| 2014-15 | 536 -82 | 402 -39 | 195 -10 | 207 -29 | 134 -43 | 54 -20 | 80 -23 |
| 2015-16 | 681 145 | 533 131 | 258 63 | 275 68 | 148 14 | 62 8 | 86 6 |
| 2016-17 | 848 167 | 649 116 | 297 39 | 352 77 | 199 51 | 86 24 | 113 27 |
| 2017-18 | 1,126 278 | 892 243 | 421 124 | 471 119 | 234 35 | 93 7 | 141 28 |
| 2018-19 | 990 -136 | 747 -145 | 317 -104 | 430 -41 | 243 9 | 108 15 | 135 -6 |
| 2019-20 | 960 -30 | 773 26 | 373 56 | 400 -30 | 187 -56 | 84 -24 | 103 -32 |
| 2020-21 | 1,008 48 | 809 36 | 373 0 | 436 36 | 199 12 | 87 3 | 112 9 |
| 2021-22 | 991 -17 | 782 -27 | 368 -5 | 414 -22 | 209 10 | 94 7 | 115 3 |
| 2022-23 | 984 -7 | 762 -20 | 350 -18 | 412 -2 | 222 13 | 107 13 | 115 0 |
| Average | 872 | 675 | 309 | 366 | 197 | 87 | 110 |