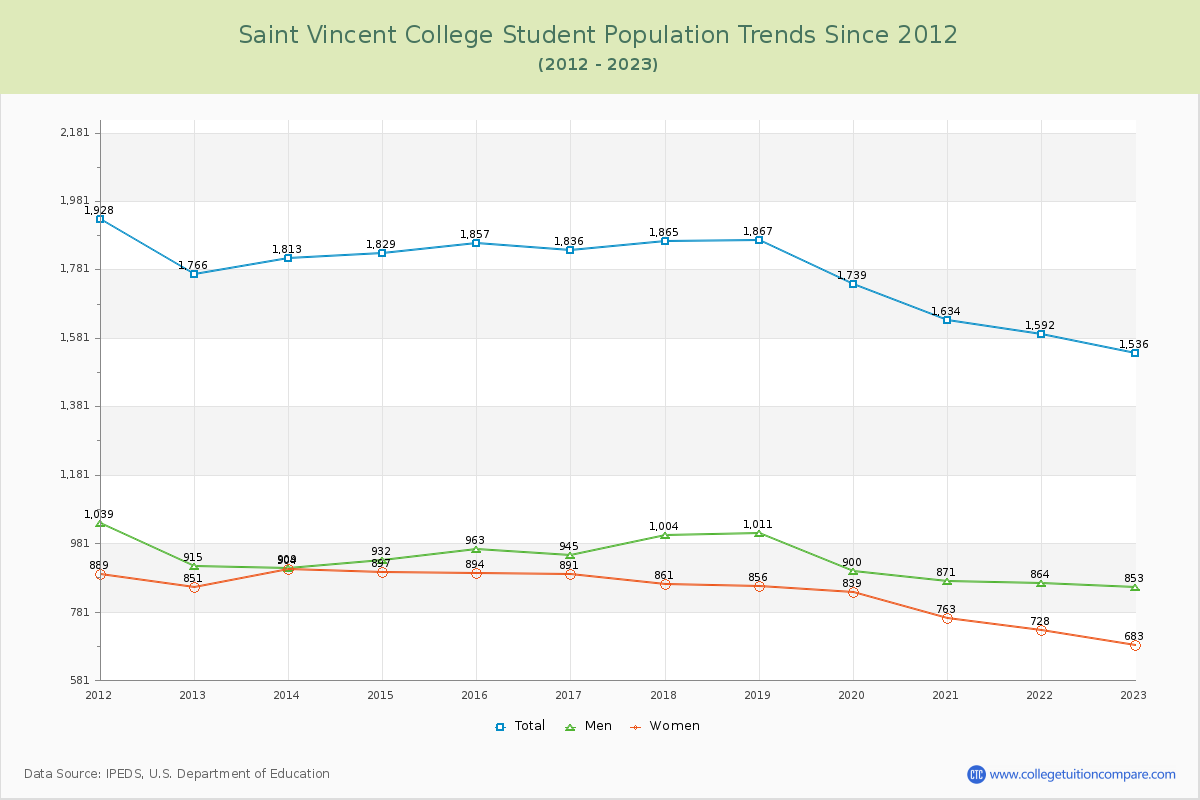
Student Population Changes
The average student population over the last 12 years is 1,758 where 1,536 students are attending the school for the academic year 2022-2023.
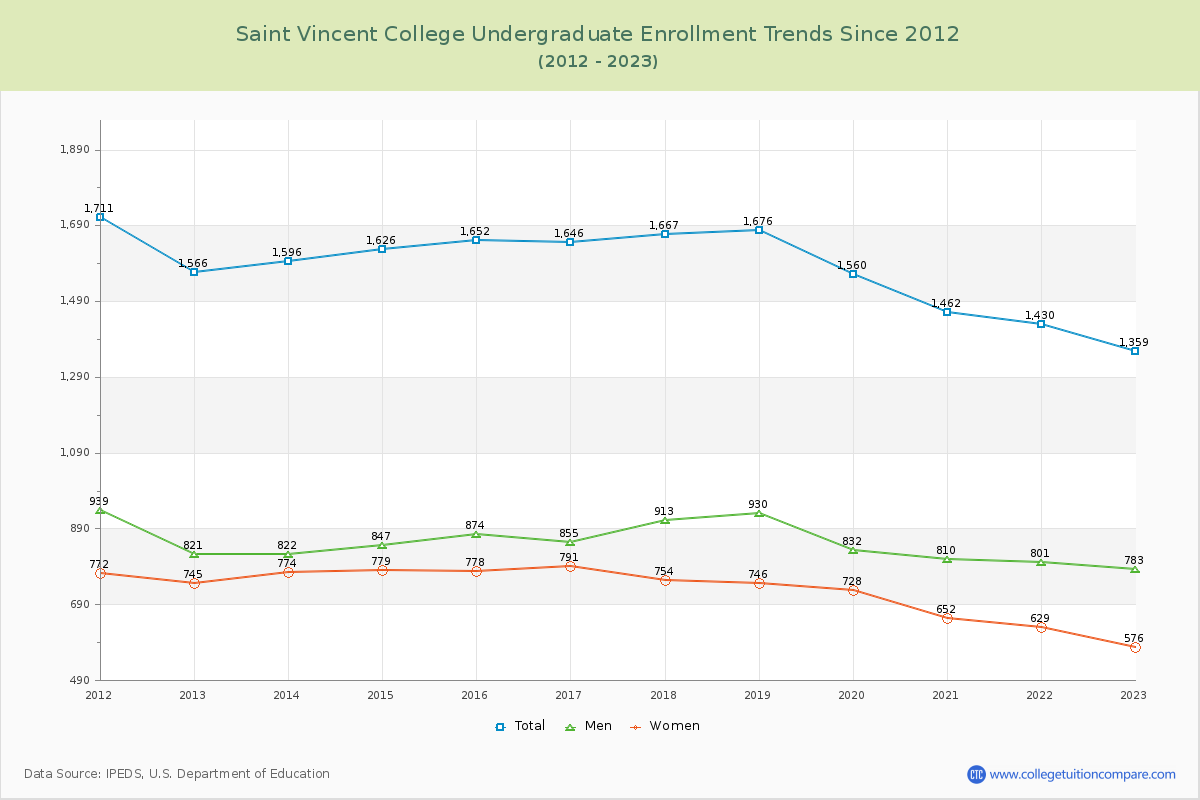
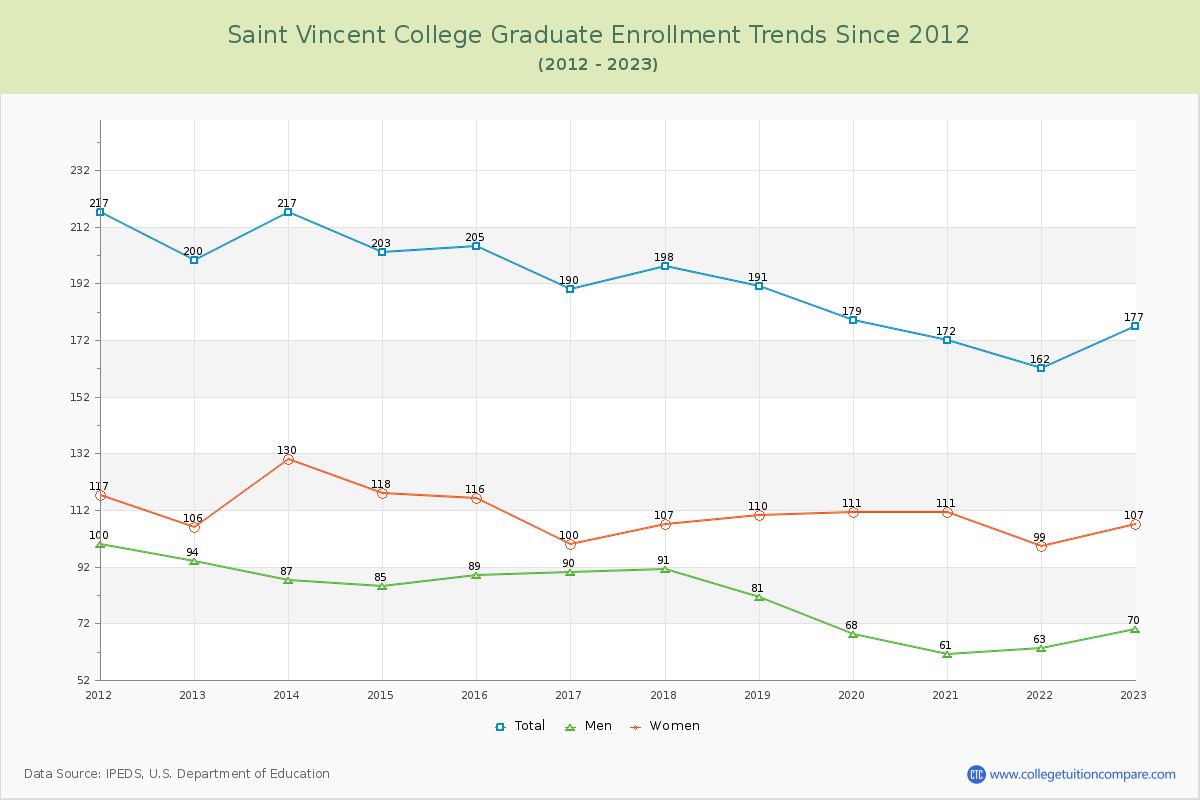
88.48% of total students is undergraduate students and 11.52% students is graduate students. The number of undergraduate students has decreased by 207 and the graduate enrollment has decreased by 23 over past 10 years.
The female to male ratio is 0.80 to 1 and it means that there are more male students enrolled in Saint Vincent than female students.
The following table and chart illustrate the changes in student population by gender at Saint Vincent College since 2012.
| Year | Total | Undergraduate | Graduate | ||||
|---|---|---|---|---|---|---|---|
| Total | Men | Women | Total | Men | Women | ||
| 2012-13 | 1,766 | 1,566 | 821 | 745 | 200 | 94 | 106 |
| 2013-14 | 1,813 47 | 1,596 30 | 822 1 | 774 29 | 217 17 | 87 -7 | 130 24 |
| 2014-15 | 1,829 16 | 1,626 30 | 847 25 | 779 5 | 203 -14 | 85 -2 | 118 -12 |
| 2015-16 | 1,857 28 | 1,652 26 | 874 27 | 778 -1 | 205 2 | 89 4 | 116 -2 |
| 2016-17 | 1,836 -21 | 1,646 -6 | 855 -19 | 791 13 | 190 -15 | 90 1 | 100 -16 |
| 2017-18 | 1,865 29 | 1,667 21 | 913 58 | 754 -37 | 198 8 | 91 1 | 107 7 |
| 2018-19 | 1,867 2 | 1,676 9 | 930 17 | 746 -8 | 191 -7 | 81 -10 | 110 3 |
| 2019-20 | 1,739 -128 | 1,560 -116 | 832 -98 | 728 -18 | 179 -12 | 68 -13 | 111 1 |
| 2020-21 | 1,634 -105 | 1,462 -98 | 810 -22 | 652 -76 | 172 -7 | 61 -7 | 111 0 |
| 2021-22 | 1,592 -42 | 1,430 -32 | 801 -9 | 629 -23 | 162 -10 | 63 2 | 99 -12 |
| 2022-23 | 1,536 -56 | 1,359 -71 | 783 -18 | 576 -53 | 177 15 | 70 7 | 107 8 |
| Average | 1,758 | 1,567 | 844 | 723 | 190 | 80 | 110 |