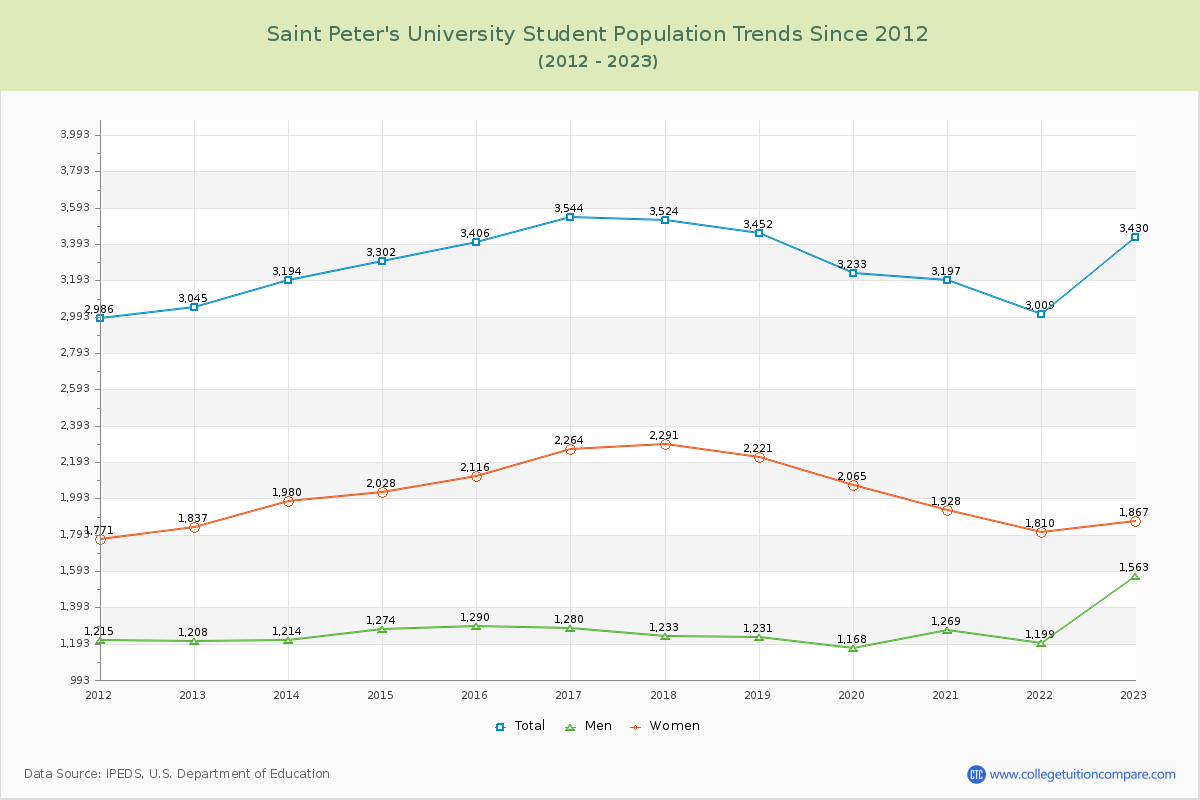
Student Population Changes
The average student population over the last 12 years is 3,303 where 3,430 students are attending the school for the academic year 2022-2023.
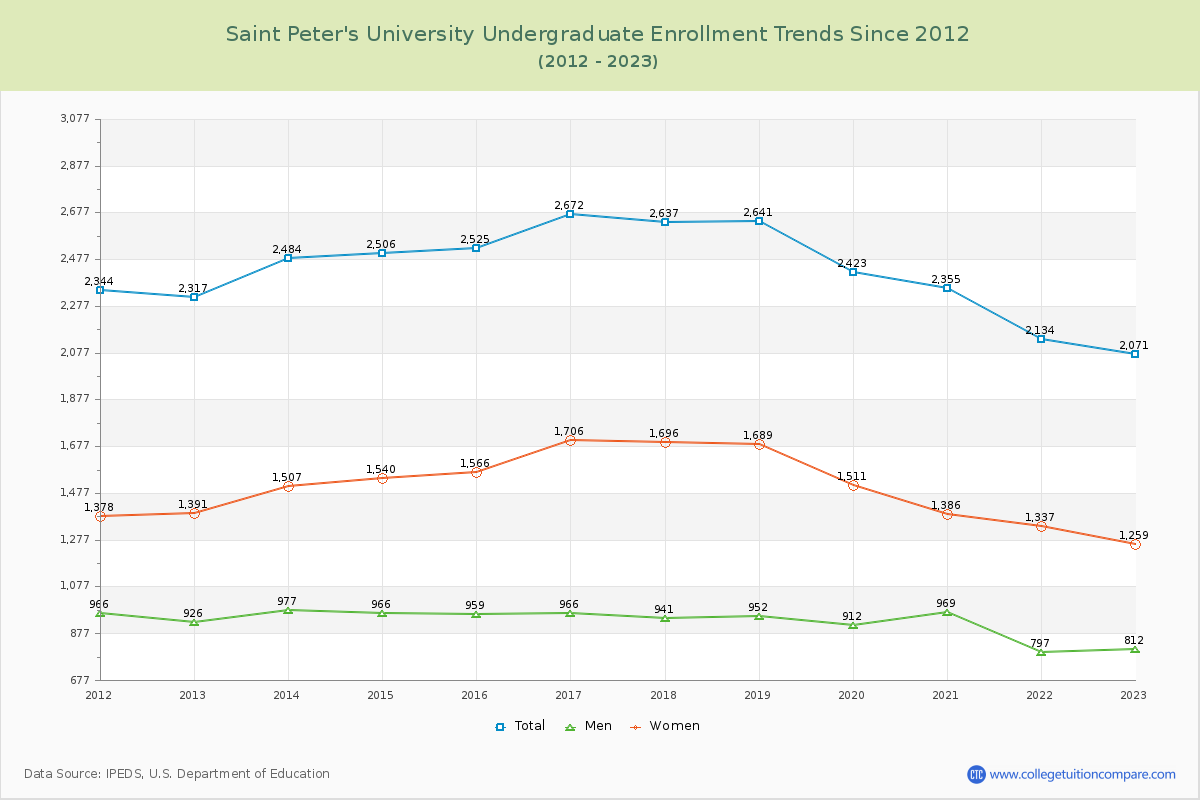
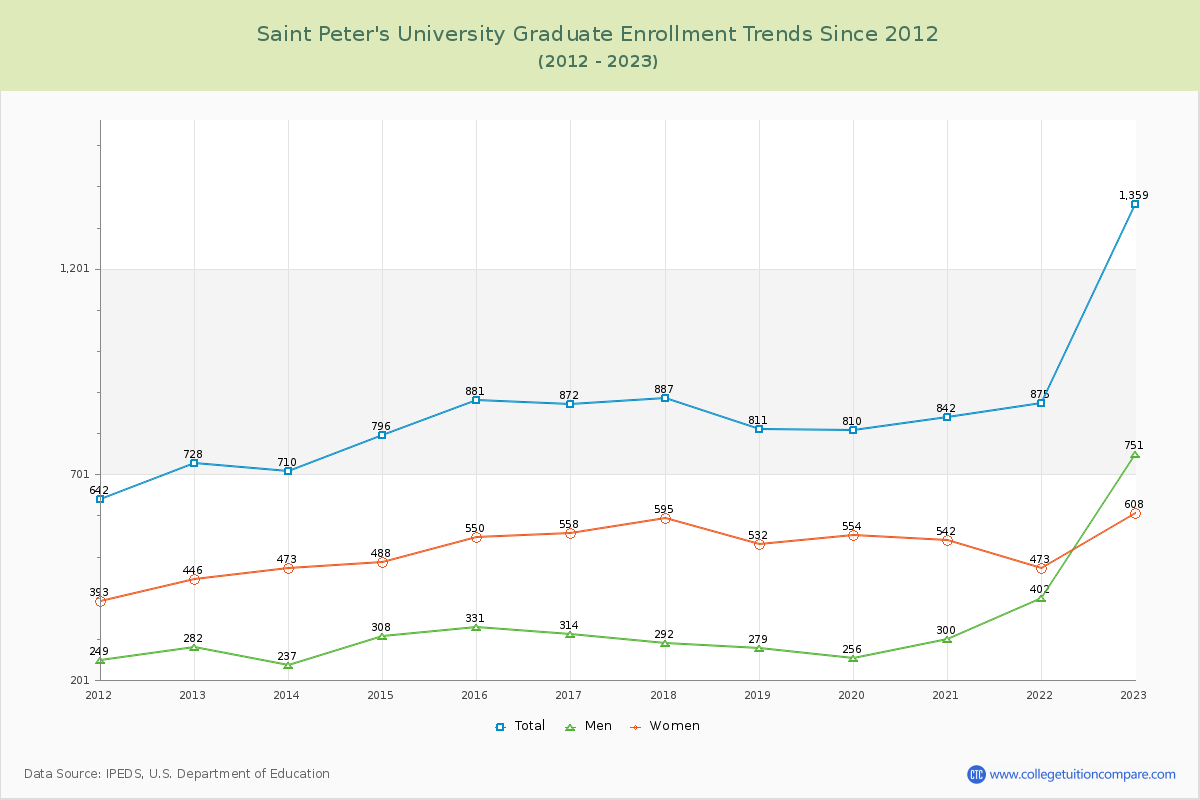
60.38% of total students is undergraduate students and 39.62% students is graduate students. The number of undergraduate students has decreased by 246 and the graduate enrollment has increased by 631 over past 10 years.
The female to male ratio is 1.19 to 1 and it means that there are slightly more female students enrolled in St. Peter's than male students.
The following table and chart illustrate the changes in student population by gender at Saint Peter's University since 2012.
| Year | Total | Undergraduate | Graduate | ||||
|---|---|---|---|---|---|---|---|
| Total | Men | Women | Total | Men | Women | ||
| 2012-13 | 3,045 | 2,317 | 926 | 1,391 | 728 | 282 | 446 |
| 2013-14 | 3,194 149 | 2,484 167 | 977 51 | 1,507 116 | 710 -18 | 237 -45 | 473 27 |
| 2014-15 | 3,302 108 | 2,506 22 | 966 -11 | 1,540 33 | 796 86 | 308 71 | 488 15 |
| 2015-16 | 3,406 104 | 2,525 19 | 959 -7 | 1,566 26 | 881 85 | 331 23 | 550 62 |
| 2016-17 | 3,544 138 | 2,672 147 | 966 7 | 1,706 140 | 872 -9 | 314 -17 | 558 8 |
| 2017-18 | 3,524 -20 | 2,637 -35 | 941 -25 | 1,696 -10 | 887 15 | 292 -22 | 595 37 |
| 2018-19 | 3,452 -72 | 2,641 4 | 952 11 | 1,689 -7 | 811 -76 | 279 -13 | 532 -63 |
| 2019-20 | 3,233 -219 | 2,423 -218 | 912 -40 | 1,511 -178 | 810 -1 | 256 -23 | 554 22 |
| 2020-21 | 3,197 -36 | 2,355 -68 | 969 57 | 1,386 -125 | 842 32 | 300 44 | 542 -12 |
| 2021-22 | 3,009 -188 | 2,134 -221 | 797 -172 | 1,337 -49 | 875 33 | 402 102 | 473 -69 |
| 2022-23 | 3,430 421 | 2,071 -63 | 812 15 | 1,259 -78 | 1,359 484 | 751 349 | 608 135 |
| Average | 3,303 | 2,433 | 925 | 1,508 | 870 | 341 | 529 |