Enrollment Trends at Saint Paul School of Theology

-65

Total Enrollment

-41

Men

-24

Women

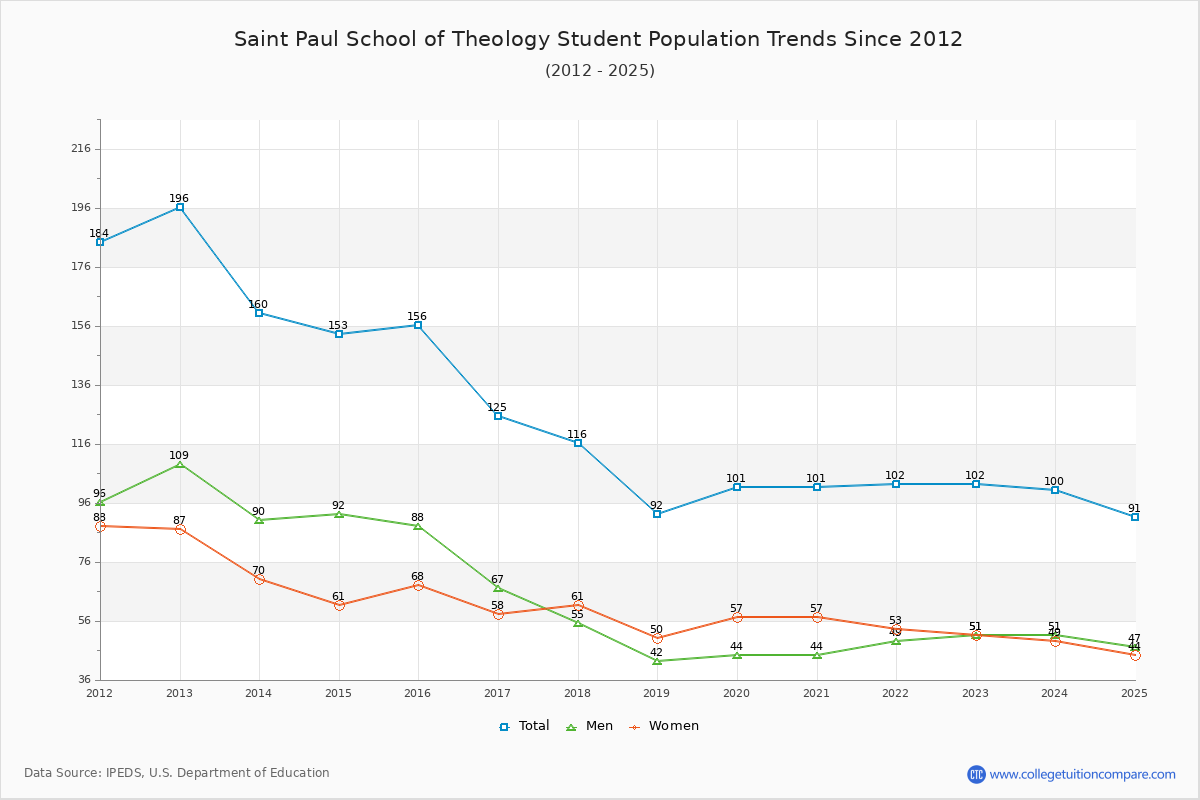
The student population at Saint Paul School of Theology is 91 (all graduate). The number of students has decreased by 65 over the past decade.

The female to male ratio is 0.94 to 1 which means that the numbers of female and male students are similar.

22 students enrolled in online degree program exclusively and the number of online students has decreased by -55.77% since 2015.

Student Population Changes

The average student population over the last 11 years is 109 where 91 students are attending the school for the academic year 2024-2025.

The female to male ratio is 0.94 to 1 and it means that there are similar numbers of female and male students enrolled in Saint Paul School of Theology.

The following table and chart illustrate the changes in student population by gender at Saint Paul School of Theology since 2015.

YearTotalMenWomen
2015-161568868
2016-17125
-31
67
-21
58
-10
2017-18116
-9
55
-12
61
3
2018-1992
-24
42
-13
50
-11
2019-20101
9
44
2
57
7
2020-211014457
2021-22102
1
49
5
53
-4
2022-2310251
2
51
-2
2023-24100
-2
5149
-2
2024-2591
-9
47
-4
44
-5
Average1095455
Saint Paul School of Theology Enrollment Trends Chart

Enrollment by Race/Ethnicity Changes

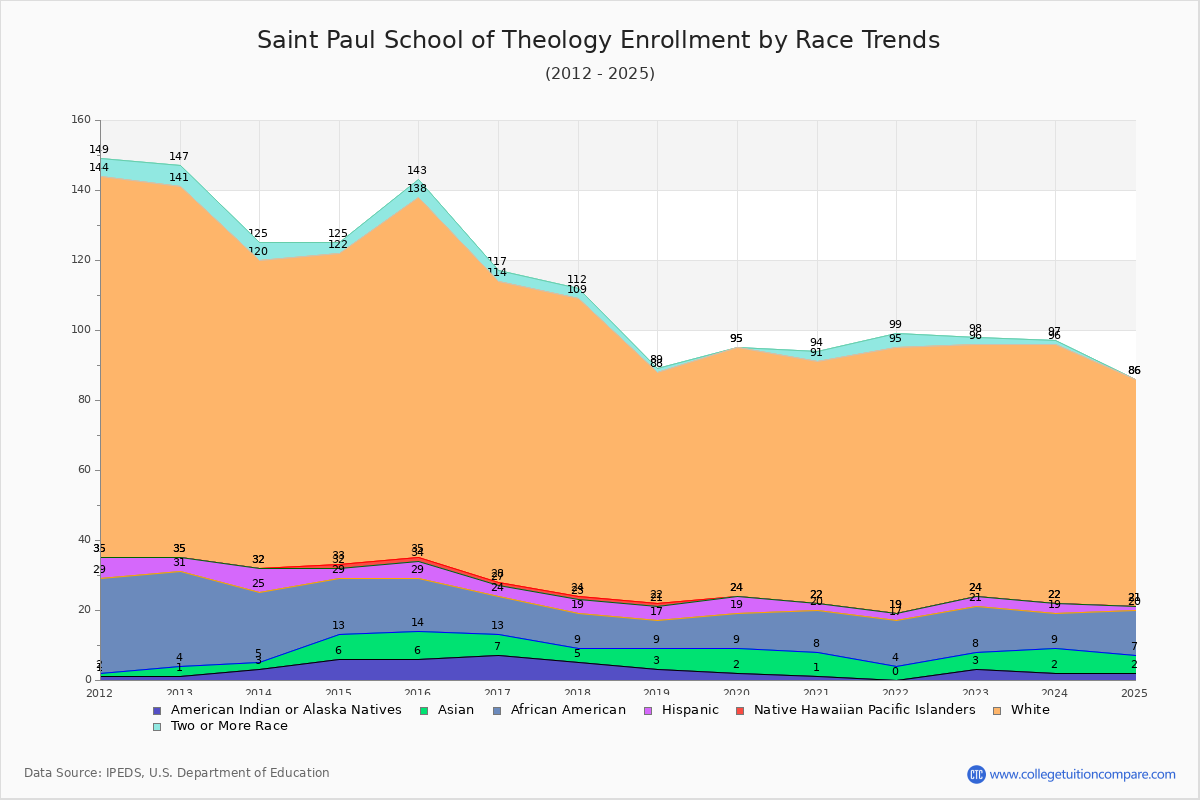
The percentage of white students is 71.43%. The percentage was 66.03% 10 years ago and Saint Paul School of Theology still has a high percentage of white students. 5.49% of enrolled students is Asian and 14.29% is black students. Hispanic students comprise 1.10% of the student body.

Over the past 10 years, the racial composition has shifted. The percentage of white students increased from 66.03% to 71.43%. Asian enrollment grew from 5.13% to 5.49%. Black student enrollment increased from 9.62% to 14.29%. Hispanic student representation contracted from 3.21% to 1.10%.

The overall racial diversity, measured by the Census Bureau Diversity Index, is 0.4658 which indicates that somewhat diverse. This decreased from 0.5486 a decade ago, suggesting that racial diversity has declined.

The following table and chart illustrate the student population trends by race/ethnicity at Saint Paul School of Theology over the past 11 years (2015-2025).

YearAmerican Indian or Native AmericanAsianBlackHispanicNative Hawaiian or Other Pacific IslanderWhiteTwo or More Races
2015-166815511035
2016-17761131863
2017-18541041853
2018-1936841661
2019-20271050710
2020-21171220693
2021-22041320764
2022-23351330722
2023-24271030741
2024-25251310650
Average361230772
Saint Paul School of Theology Enrollment by Race Trends Chart

Distance Learning (Online Courses) Enrollment Changes

22 students are enrolled in online degree programs exclusively for the academic year 2024-2025, which is 24% of total students. The number of online students has decreased -55.77% since 2015. The following table and chart illustrate the changes in the online student population by enrolled type at Saint Paul School of Theology from 2015 to 2025.

YearTotal EnrollmentOnline CompletelyEnrolled in Some Online CoursesNot Enrolled in Online Courses
2015-1615601560
2016-1712567544
2017-1811604670
2018-19926860
2019-2010110865
2020-211015960
2021-2210213872
2022-2310215843
2023-2410025678
2024-259122690
Average109108513

Ratings & Review

Share your experiences and thoughts about Saint Paul School of Theology. It will be a great help to applicants and prospective students!