Enrollment Trends at Saint Mary's

-56

Total Enrollment

0

Men

-56

Women

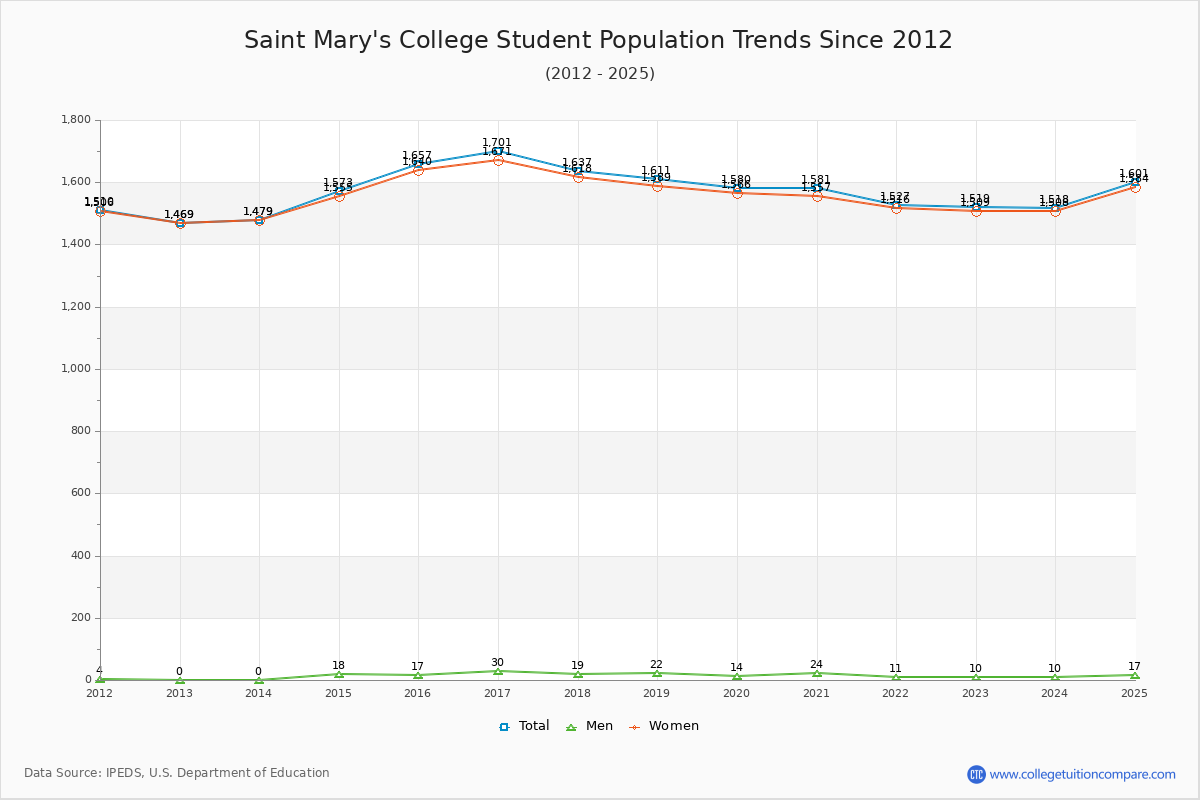
The student population at Saint Mary's College is 1,601 (1,505 undergraduate and 96 graduate students) . The number of students has decreased by 56 over the past decade.

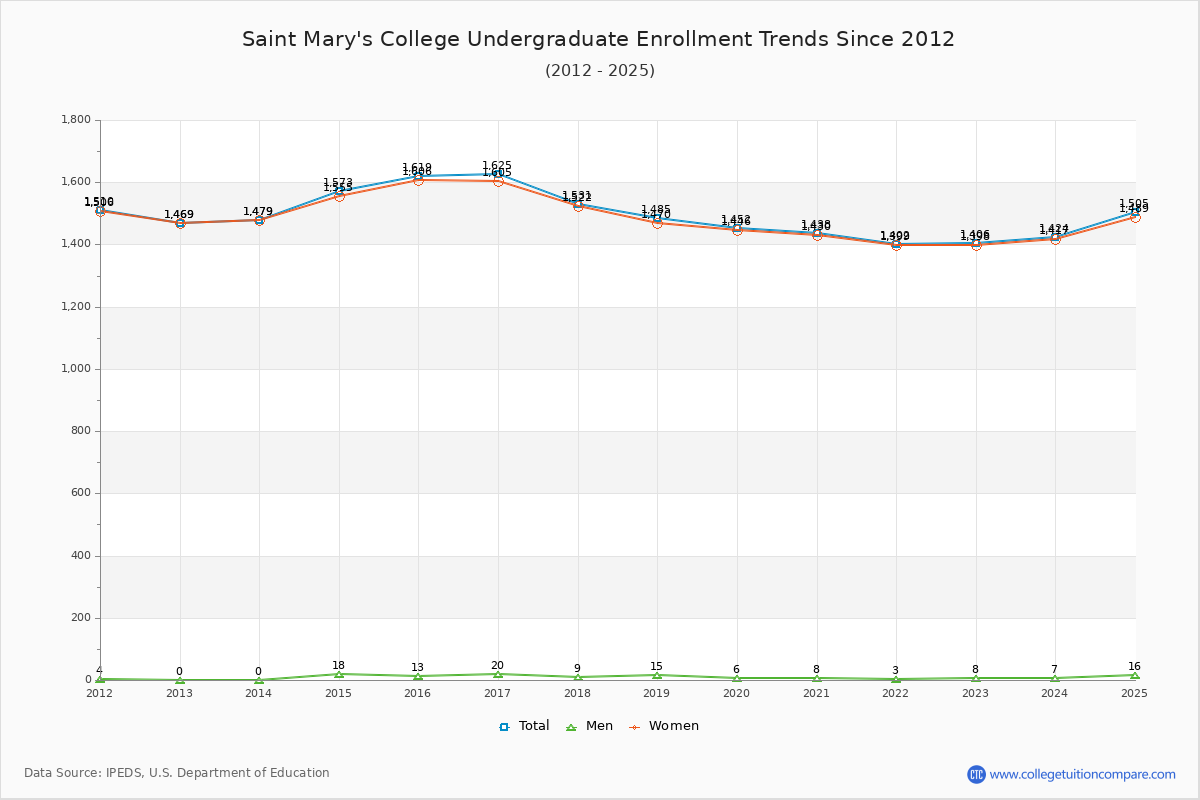
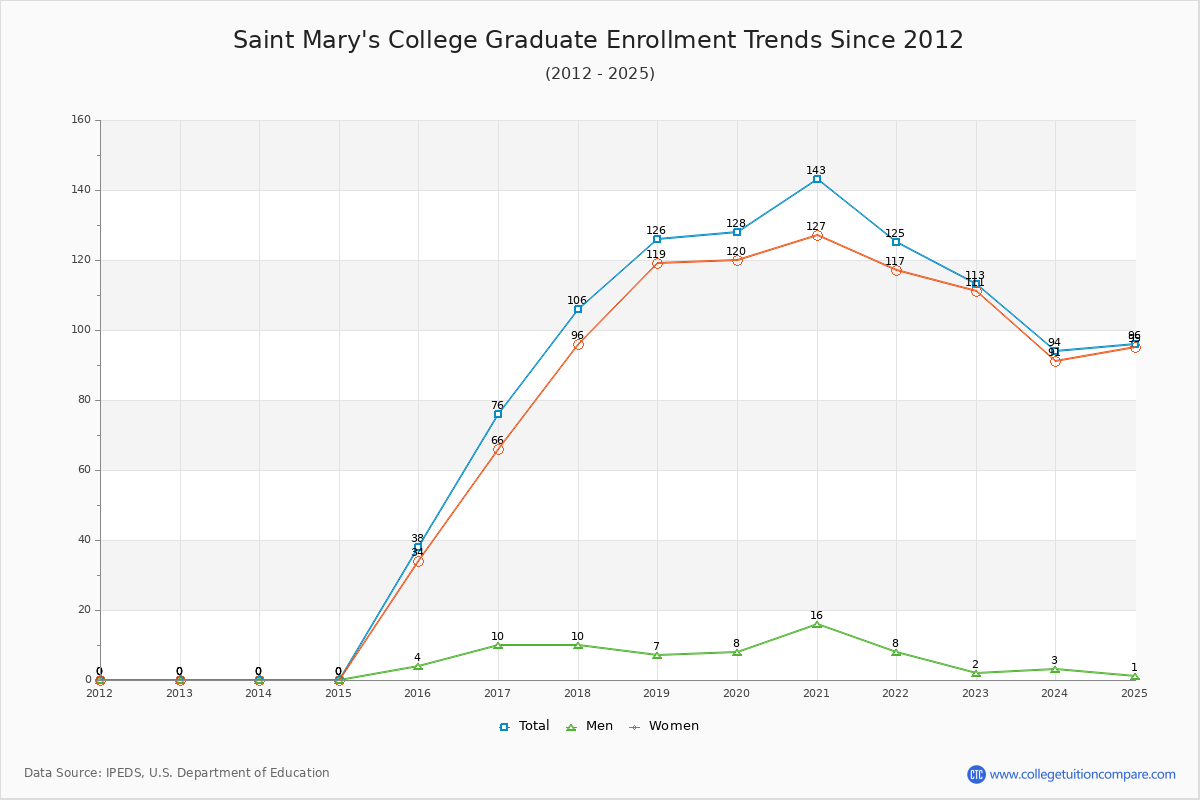
The percentage of undergraduate students at Saint Mary's is 94.00% which is decreased by 114 over last 10 years. The graduate student population increased by 58 and it has been increasing.

45 students enrolled in online degree program exclusively and the number of online students has increased by 221.43% since 2015.

Student Population Changes

The average student population over the last 11 years is 1,593 where 1,601 students are attending the school for the academic year 2024-2025.

94.00% of total students is undergraduate students and 6.00% students is graduate students. The number of undergraduate students has decreased by 114 and the graduate enrollment has increased by 58 over past 10 years.

The following table and chart illustrate the changes in student population by gender at Saint Mary's College since 2015.

YearTotalUndergraduateGraduate
TotalMenWomenTotalMenWomen
2015-161,6571,619131,60638434
2016-171,701
44
1,625
6
20
7
1,605
-1
76
38
10
6
66
32
2017-181,637
-64
1,531
-94
9
-11
1,522
-83
106
30
1096
30
2018-191,611
-26
1,485
-46
15
6
1,470
-52
126
20
7
-3
119
23
2019-201,580
-31
1,452
-33
6
-9
1,446
-24
128
2
8
1
120
1
2020-211,581
1
1,438
-14
8
2
1,430
-16
143
15
16
8
127
7
2021-221,527
-54
1,402
-36
3
-5
1,399
-31
125
-18
8
-8
117
-10
2022-231,519
-8
1,406
4
8
5
1,398
-1
113
-12
2
-6
111
-6
2023-241,518
-1
1,424
18
7
-1
1,417
19
94
-19
3
1
91
-20
2024-251,601
83
1,505
81
16
9
1,489
72
96
2
1
-2
95
4
Average1,5931,489111,478105798
Saint Mary's College Enrollment Trends Chart

Undergraduate Enrollment Changes

The average number of Undergraduate students over the last 11 years is 1,489 where 1,505 students are attending the Undergraduate school for the academic year 2024-2025. The following table and chart illustrate the changes in Undergraduate enrollment by attending status and gender at Saint Mary's College since 2015.

YearTotalFull-timePart-time
TotalMenWomenTotalMenWomen
2015-161,6191,55801,558611348
2016-171,6251,56901,569562036
2017-181,5311,48601,48645936
2018-191,4851,43601,436491534
2019-201,4521,42101,42131625
2020-211,4381,40301,40335827
2021-221,4021,36801,36834331
2022-231,4061,37611,37530723
2023-241,4241,39301,39331724
2024-251,5051,46101,461441628
Average1,4891,48901,4471,4891031
Saint Mary's College Undergraduate Enrollment Trends Chart

Graduate Enrollment Changes

The average number of Graduate students over the last 11 years is 105 where 96 students are attending the Graduate school for the academic year 2024-2025. The following table and chart illustrate the changes in Graduate enrollment by attending status and gender at Saint Mary's College since 2015.

YearTotalFull-timePart-time
TotalMenWomenTotalMenWomen
2015-163829326918
2016-17765044626620
2017-1810657057491039
2018-191266106165758
2019-201286306365857
2020-2114373271701456
2021-221256316262755
2022-231136015953152
2023-24945725537136
2024-25966216134034
Average105105156105642
Saint Mary's College Graduate Enrollment Trends Chart

Enrollment by Race/Ethnicity Changes

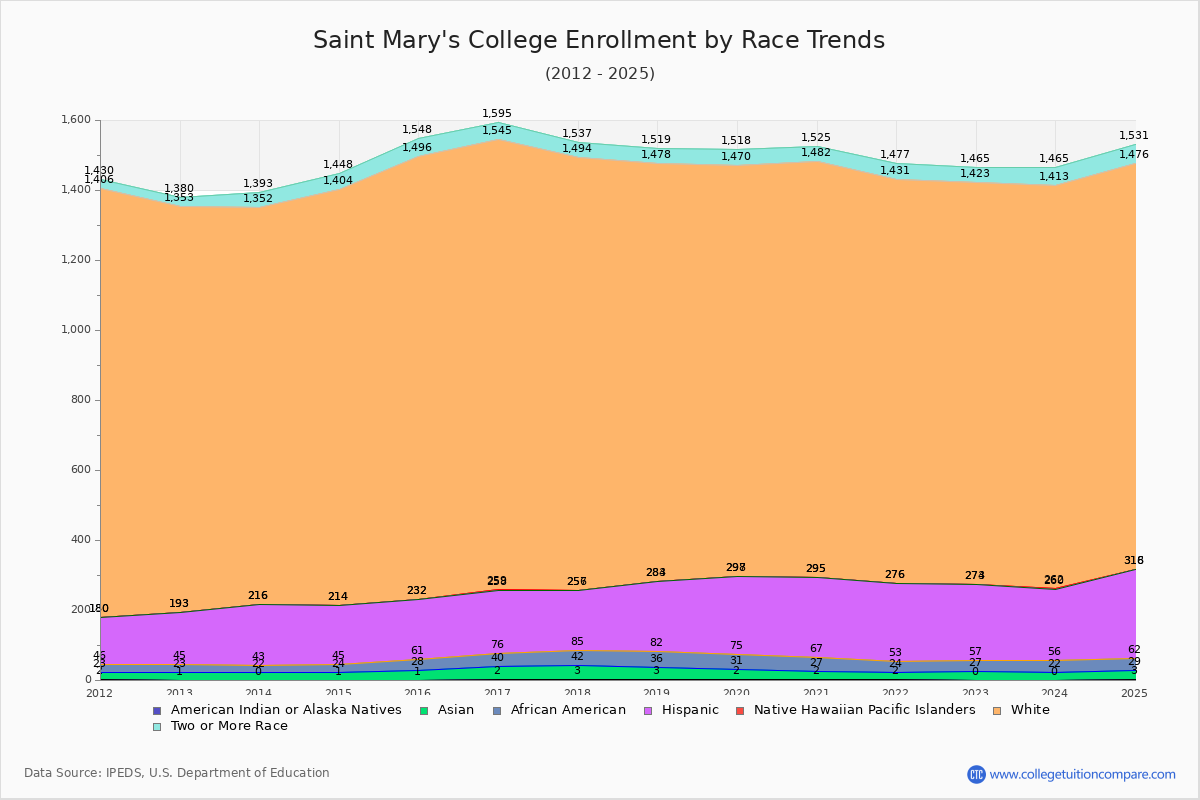
The percentage of white students is 72.33%. The percentage was 76.28% 10 years ago and Saint Mary's still has a high percentage of white students. 1.62% of enrolled students is Asian and 2.06% is black students. Hispanic students comprise 15.87% of the student body.

Over the past 10 years, the racial composition has shifted. The percentage of white students decreased from 76.28% to 72.33%. Asian enrollment declined from 1.63% to 1.62%. Black student enrollment increased from 1.99% to 2.06%. Hispanic student representation expanded from 10.32% to 15.87%.

The overall racial diversity, measured by the Census Bureau Diversity Index, is 0.4498 which indicates that somewhat diverse. This increased from 0.4058 a decade ago, suggesting that racial diversity has improved.

The following table and chart illustrate the student population trends by race/ethnicity at Saint Mary's College over the past 11 years (2015-2025).

YearAmerican Indian or Native AmericanAsianBlackHispanicNative Hawaiian or Other Pacific IslanderWhiteTwo or More Races
2015-161273317101,26452
2016-172383618211,28650
2017-183394317111,23743
2018-193334620111,19441
2019-202294422211,17248
2020-212254022801,18743
2021-222222922301,15546
2022-230273021611,14942
2023-240223420421,15152
2024-253263325421,15855
Average2293720711,19547
Saint Mary's College Enrollment by Race Trends Chart

Distance Learning (Online Courses) Enrollment Changes

45 students are enrolled in online degree programs exclusively for the academic year 2024-2025, which is 3% of total students. The number of online students has increased 221.43% since 2015. The following table and chart illustrate the changes in the online student population by enrolled type at Saint Mary's College from 2015 to 2025.

YearTotal EnrollmentOnline CompletelyEnrolled in Some Online CoursesNot Enrolled in Online Courses
2015-161,6571401,643
2016-171,70131291,641
2017-181,6375021,585
2018-191,6116531,543
2019-201,58056151,509
2020-211,581714761,034
2021-221,52763291,435
2022-231,51952261,441
2023-241,51851391,428
2024-251,60145311,525
Average1,59350651,478

Ratings & Review

  1. J
    Judi (Parent)
    No Thanks

    It seems to have changed over the years. It seems to have gotten woke. That is not a compliment, especially in the LGBTQ whatever category whites are now a minority at this once proud institution I would definitely pass it up because I know kids who were way more qualified, SAT grades private high schools and extracurriculars than ones that they accepted so we’ve closed our purse and we moved on to other universities— you are for selective based on merit rather than wokeness/DEI— I would not consider this a Catholic university any longer

    Judi does not recommend the school.