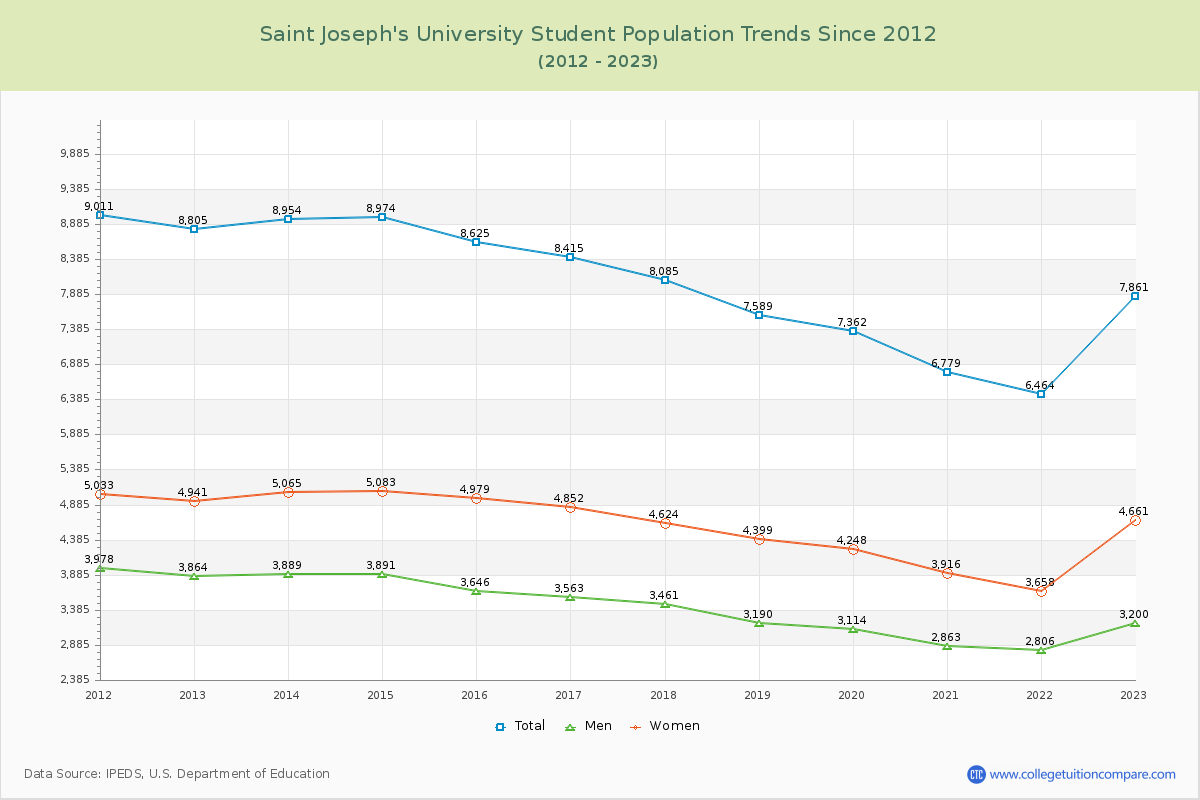
Student Population Changes
The average student population over the last 12 years is 7,992 where 7,861 students are attending the school for the academic year 2022-2023.
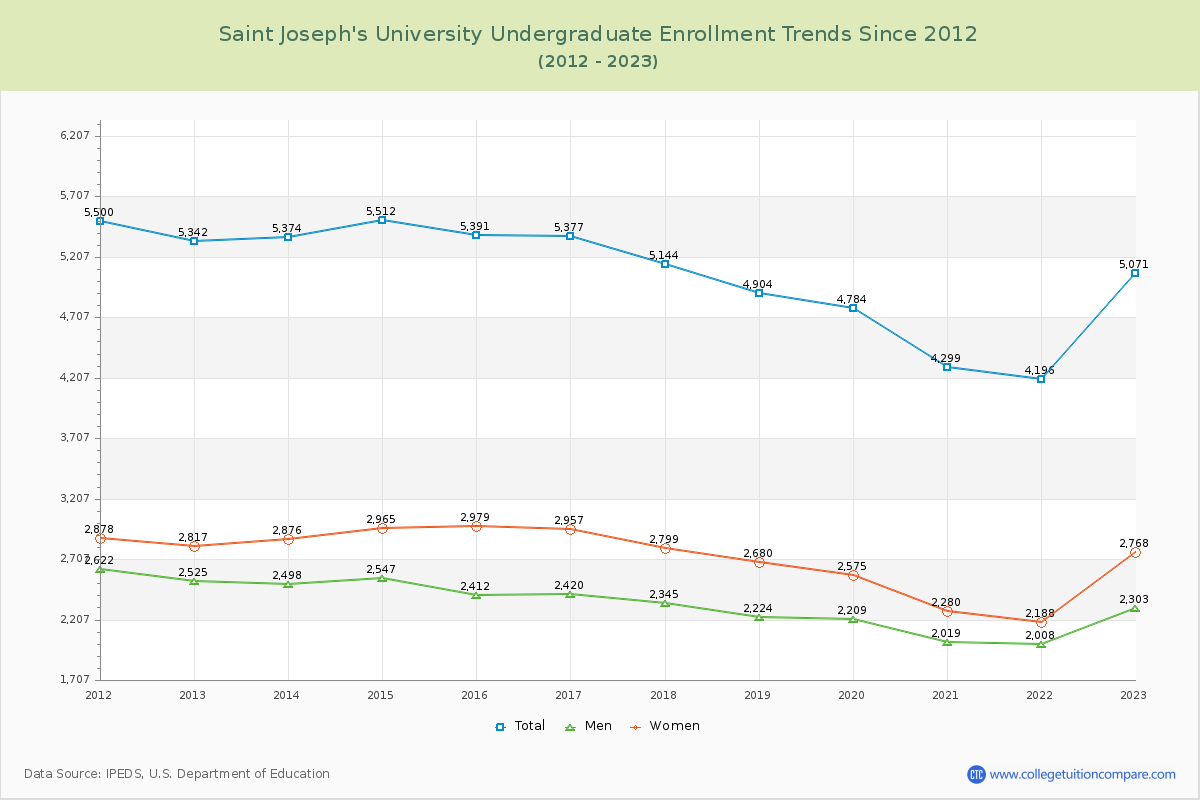
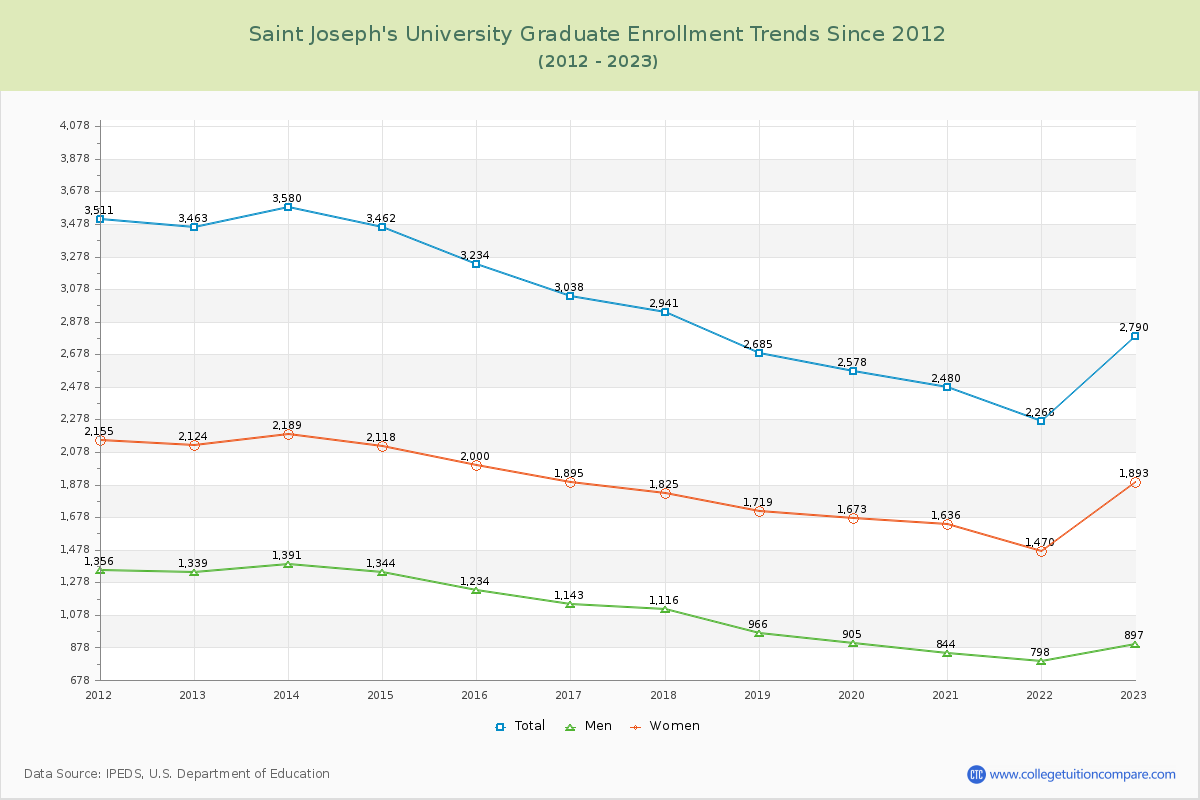
64.51% of total students is undergraduate students and 35.49% students is graduate students. The number of undergraduate students has decreased by 271 and the graduate enrollment has decreased by 673 over past 10 years.
The female to male ratio is 1.46 to 1 and it means that there are more female students enrolled in Saint Joseph's than male students.
The following table and chart illustrate the changes in student population by gender at Saint Joseph's University since 2012.
| Year | Total | Undergraduate | Graduate | ||||
|---|---|---|---|---|---|---|---|
| Total | Men | Women | Total | Men | Women | ||
| 2012-13 | 8,805 | 5,342 | 2,525 | 2,817 | 3,463 | 1,339 | 2,124 |
| 2013-14 | 8,954 149 | 5,374 32 | 2,498 -27 | 2,876 59 | 3,580 117 | 1,391 52 | 2,189 65 |
| 2014-15 | 8,974 20 | 5,512 138 | 2,547 49 | 2,965 89 | 3,462 -118 | 1,344 -47 | 2,118 -71 |
| 2015-16 | 8,625 -349 | 5,391 -121 | 2,412 -135 | 2,979 14 | 3,234 -228 | 1,234 -110 | 2,000 -118 |
| 2016-17 | 8,415 -210 | 5,377 -14 | 2,420 8 | 2,957 -22 | 3,038 -196 | 1,143 -91 | 1,895 -105 |
| 2017-18 | 8,085 -330 | 5,144 -233 | 2,345 -75 | 2,799 -158 | 2,941 -97 | 1,116 -27 | 1,825 -70 |
| 2018-19 | 7,589 -496 | 4,904 -240 | 2,224 -121 | 2,680 -119 | 2,685 -256 | 966 -150 | 1,719 -106 |
| 2019-20 | 7,362 -227 | 4,784 -120 | 2,209 -15 | 2,575 -105 | 2,578 -107 | 905 -61 | 1,673 -46 |
| 2020-21 | 6,779 -583 | 4,299 -485 | 2,019 -190 | 2,280 -295 | 2,480 -98 | 844 -61 | 1,636 -37 |
| 2021-22 | 6,464 -315 | 4,196 -103 | 2,008 -11 | 2,188 -92 | 2,268 -212 | 798 -46 | 1,470 -166 |
| 2022-23 | 7,861 1,397 | 5,071 875 | 2,303 295 | 2,768 580 | 2,790 522 | 897 99 | 1,893 423 |
| Average | 7,992 | 5,036 | 2,319 | 2,717 | 2,956 | 1,089 | 1,867 |