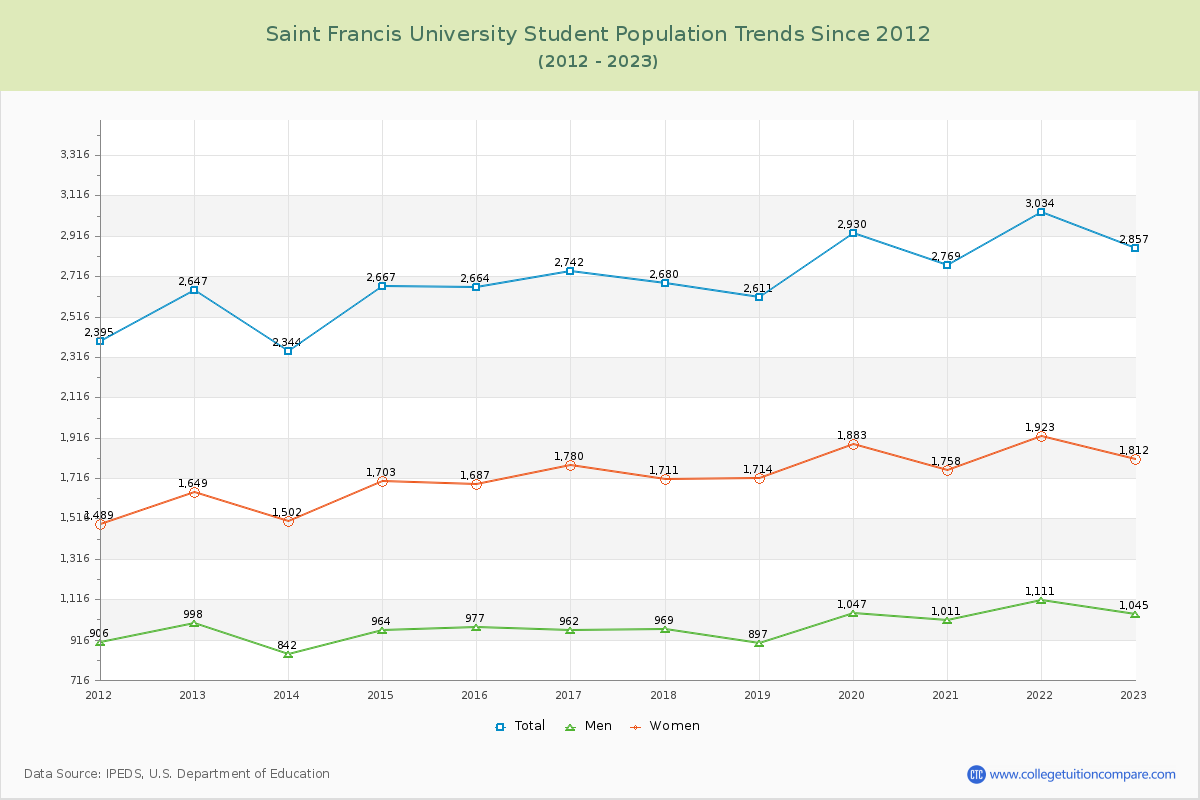
Student Population Changes
The average student population over the last 12 years is 2,722 where 2,857 students are attending the school for the academic year 2022-2023.
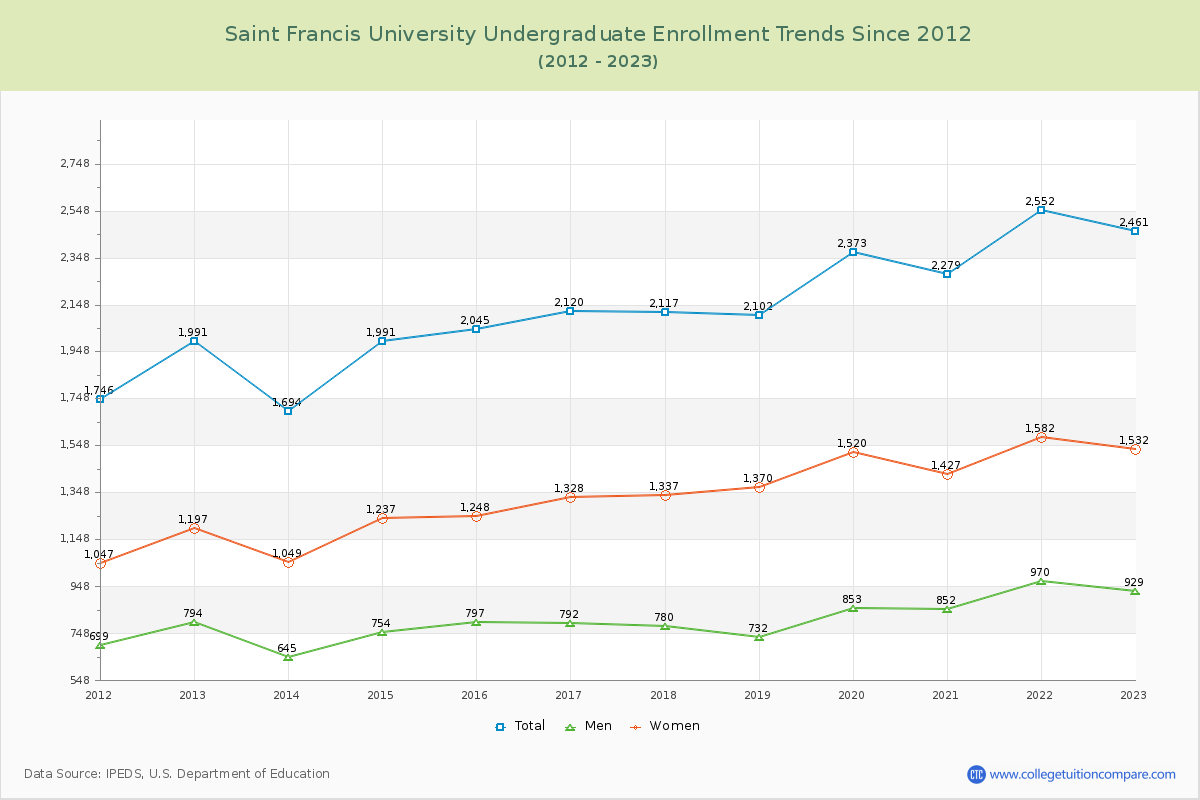
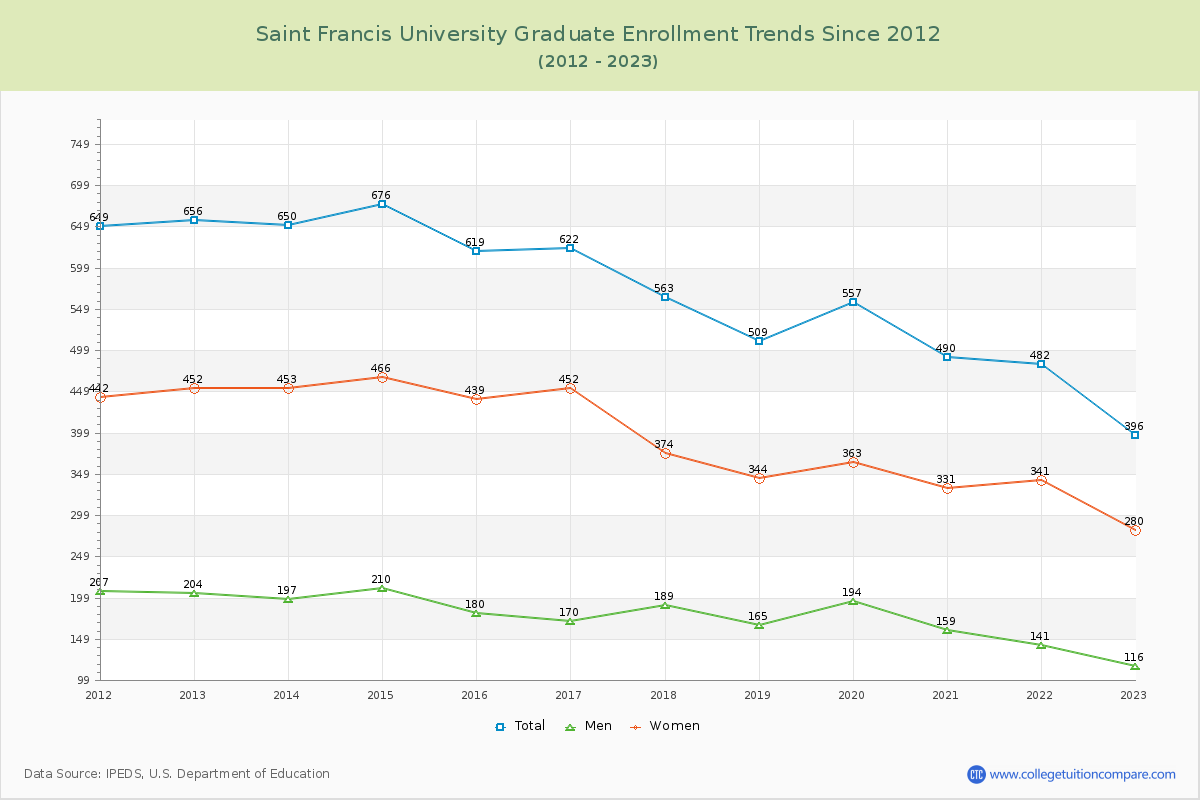
86.14% of total students is undergraduate students and 13.86% students is graduate students. The number of undergraduate students has increased by 470 and the graduate enrollment has decreased by 260 over past 10 years.
The female to male ratio is 1.73 to 1 and it means that there are more female students enrolled in Saint Francis than male students.
The following table and chart illustrate the changes in student population by gender at Saint Francis University since 2012.
| Year | Total | Undergraduate | Graduate | ||||
|---|---|---|---|---|---|---|---|
| Total | Men | Women | Total | Men | Women | ||
| 2012-13 | 2,647 | 1,991 | 794 | 1,197 | 656 | 204 | 452 |
| 2013-14 | 2,344 -303 | 1,694 -297 | 645 -149 | 1,049 -148 | 650 -6 | 197 -7 | 453 1 |
| 2014-15 | 2,667 323 | 1,991 297 | 754 109 | 1,237 188 | 676 26 | 210 13 | 466 13 |
| 2015-16 | 2,664 -3 | 2,045 54 | 797 43 | 1,248 11 | 619 -57 | 180 -30 | 439 -27 |
| 2016-17 | 2,742 78 | 2,120 75 | 792 -5 | 1,328 80 | 622 3 | 170 -10 | 452 13 |
| 2017-18 | 2,680 -62 | 2,117 -3 | 780 -12 | 1,337 9 | 563 -59 | 189 19 | 374 -78 |
| 2018-19 | 2,611 -69 | 2,102 -15 | 732 -48 | 1,370 33 | 509 -54 | 165 -24 | 344 -30 |
| 2019-20 | 2,930 319 | 2,373 271 | 853 121 | 1,520 150 | 557 48 | 194 29 | 363 19 |
| 2020-21 | 2,769 -161 | 2,279 -94 | 852 -1 | 1,427 -93 | 490 -67 | 159 -35 | 331 -32 |
| 2021-22 | 3,034 265 | 2,552 273 | 970 118 | 1,582 155 | 482 -8 | 141 -18 | 341 10 |
| 2022-23 | 2,857 -177 | 2,461 -91 | 929 -41 | 1,532 -50 | 396 -86 | 116 -25 | 280 -61 |
| Average | 2,722 | 2,157 | 809 | 1,348 | 565 | 175 | 390 |