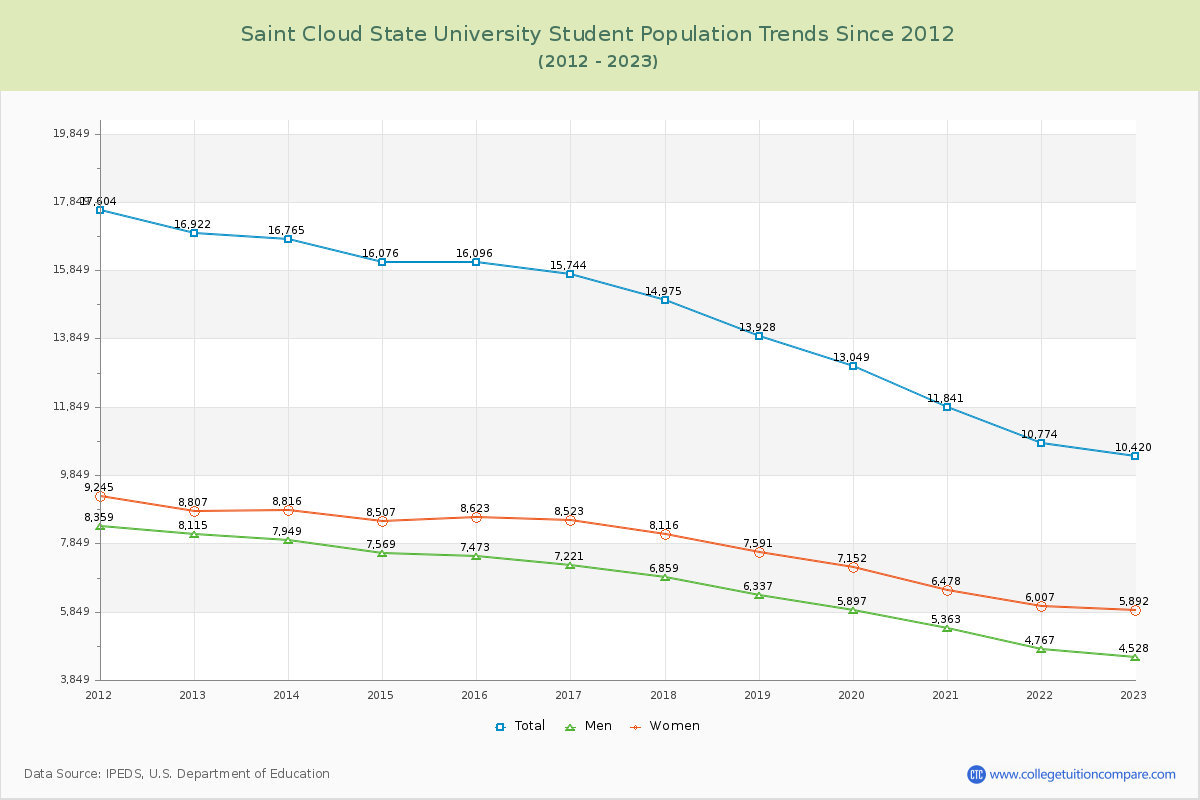
Student Population Changes
The average student population over the last 12 years is 14,235 where 10,420 students are attending the school for the academic year 2022-2023.
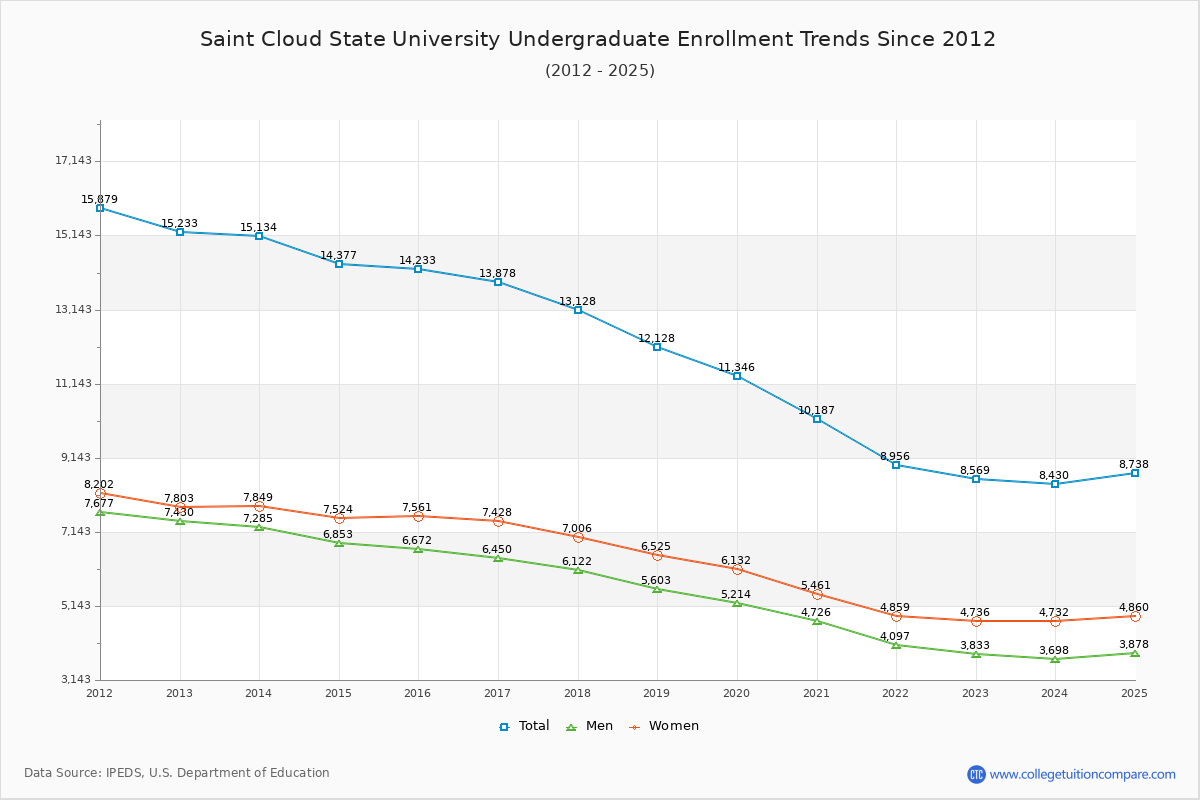
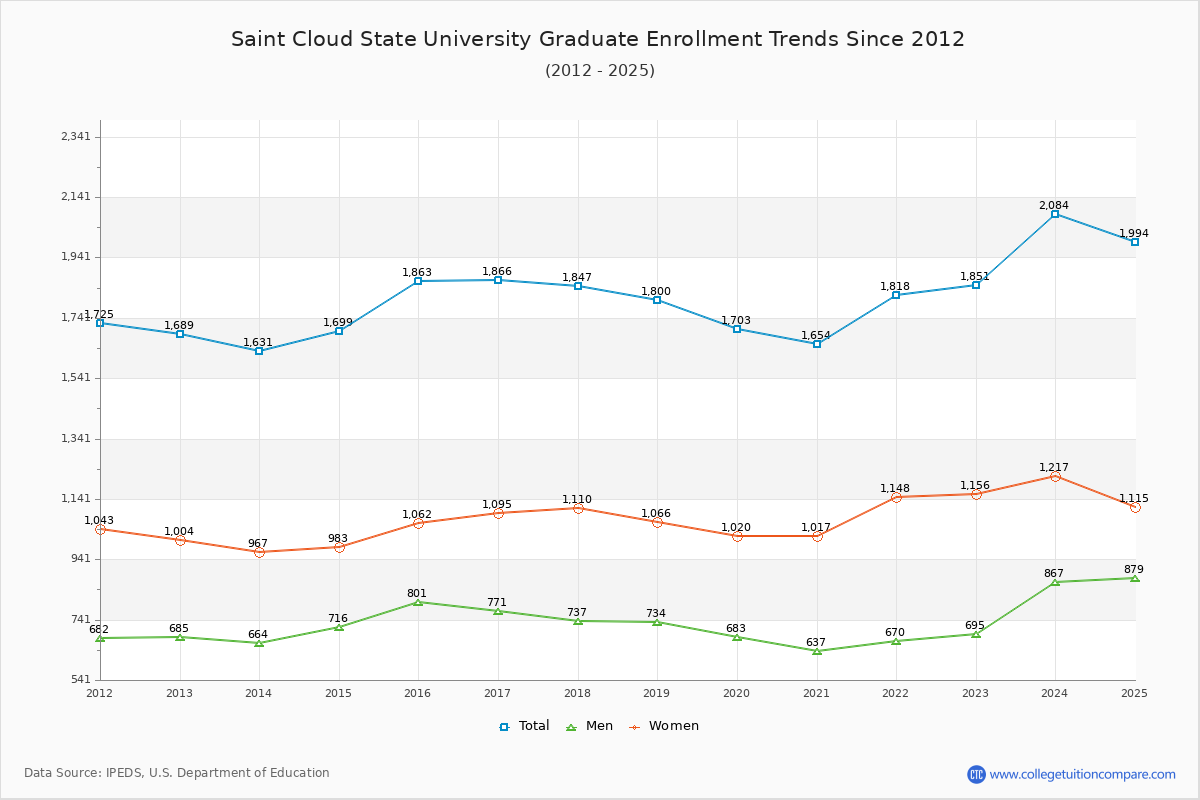
82.24% of total students is undergraduate students and 17.76% students is graduate students. The number of undergraduate students has decreased by 6,664 and the graduate enrollment has increased by 162 over past 10 years.
The female to male ratio is 1.30 to 1 and it means that there are slightly more female students enrolled in Saint Cloud State than male students.
The following table and chart illustrate the changes in student population by gender at Saint Cloud State University since 2012.
| Year | Total | Undergraduate | Graduate | ||||
|---|---|---|---|---|---|---|---|
| Total | Men | Women | Total | Men | Women | ||
| 2012-13 | 16,922 | 15,233 | 7,430 | 7,803 | 1,689 | 685 | 1,004 |
| 2013-14 | 16,765 -157 | 15,134 -99 | 7,285 -145 | 7,849 46 | 1,631 -58 | 664 -21 | 967 -37 |
| 2014-15 | 16,076 -689 | 14,377 -757 | 6,853 -432 | 7,524 -325 | 1,699 68 | 716 52 | 983 16 |
| 2015-16 | 16,096 20 | 14,233 -144 | 6,672 -181 | 7,561 37 | 1,863 164 | 801 85 | 1,062 79 |
| 2016-17 | 15,744 -352 | 13,878 -355 | 6,450 -222 | 7,428 -133 | 1,866 3 | 771 -30 | 1,095 33 |
| 2017-18 | 14,975 -769 | 13,128 -750 | 6,122 -328 | 7,006 -422 | 1,847 -19 | 737 -34 | 1,110 15 |
| 2018-19 | 13,928 -1,047 | 12,128 -1,000 | 5,603 -519 | 6,525 -481 | 1,800 -47 | 734 -3 | 1,066 -44 |
| 2019-20 | 13,049 -879 | 11,346 -782 | 5,214 -389 | 6,132 -393 | 1,703 -97 | 683 -51 | 1,020 -46 |
| 2020-21 | 11,841 -1,208 | 10,187 -1,159 | 4,726 -488 | 5,461 -671 | 1,654 -49 | 637 -46 | 1,017 -3 |
| 2021-22 | 10,774 -1,067 | 8,956 -1,231 | 4,097 -629 | 4,859 -602 | 1,818 164 | 670 33 | 1,148 131 |
| 2022-23 | 10,420 -354 | 8,569 -387 | 3,833 -264 | 4,736 -123 | 1,851 33 | 695 25 | 1,156 8 |
| Average | 14,235 | 12,470 | 5,844 | 6,626 | 1,766 | 708 | 1,057 |