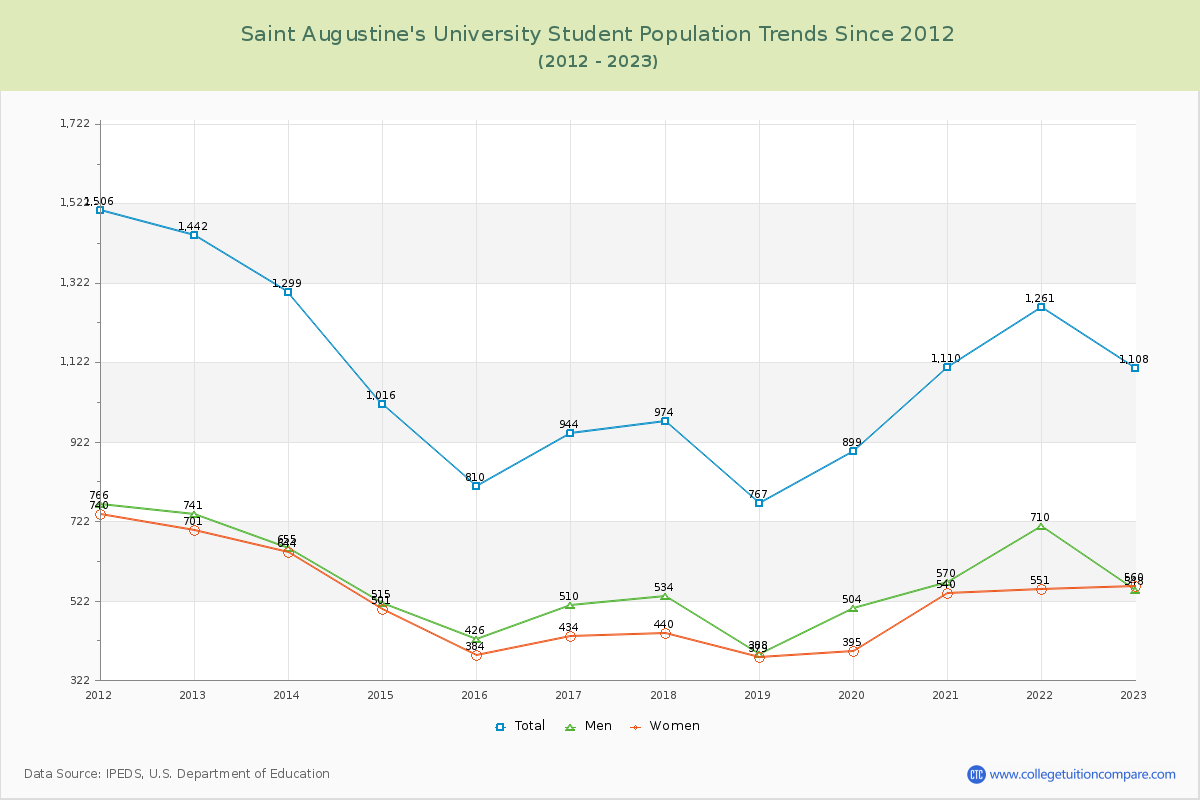
Student Population Changes
The average student population over the last 12 years is 1,057 where 1,108 students are attending the school for the academic year 2022-2023.
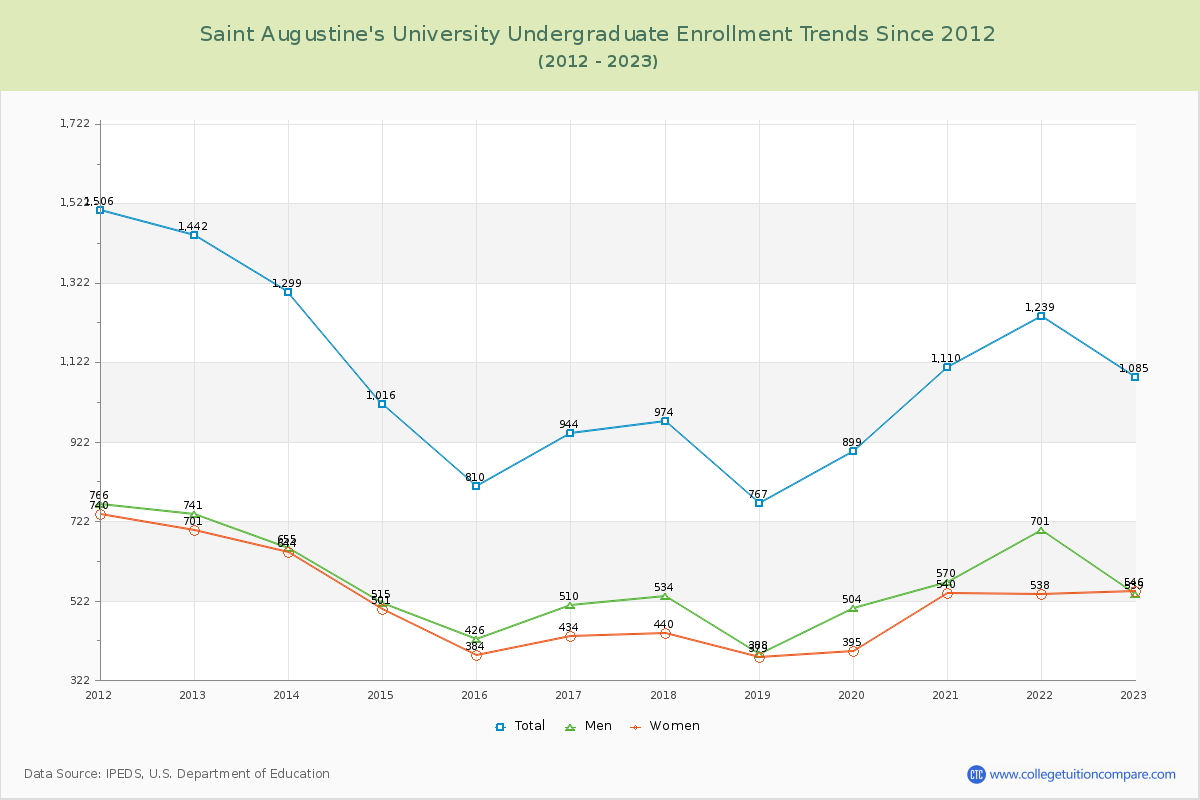
97.92% of total students is undergraduate students and 2.08% students is graduate students. The number of undergraduate students has decreased by 357 and the graduate enrollment has increased by 23 over past 10 years.
The female to male ratio is 1.02 to 1 and it means that there are similar numbers of female and male students enrolled in Saint Augustine's.
The following table and chart illustrate the changes in student population by gender at Saint Augustine's University since 2012.
| Year | Total | Undergraduate | Graduate | ||||
|---|---|---|---|---|---|---|---|
| Total | Men | Women | Total | Men | Women | ||
| 2012-13 | 1,442 | 1,442 | 741 | 701 | 0 | 0 | 0 |
| 2013-14 | 1,299 -143 | 1,299 -143 | 655 -86 | 644 -57 | 0 0 | 0 0 | 0 0 |
| 2014-15 | 1,016 -283 | 1,016 -283 | 515 -140 | 501 -143 | 0 0 | 0 0 | 0 0 |
| 2015-16 | 810 -206 | 810 -206 | 426 -89 | 384 -117 | 0 0 | 0 0 | 0 0 |
| 2016-17 | 944 134 | 944 134 | 510 84 | 434 50 | 0 0 | 0 0 | 0 0 |
| 2017-18 | 974 30 | 974 30 | 534 24 | 440 6 | 0 0 | 0 0 | 0 0 |
| 2018-19 | 767 -207 | 767 -207 | 388 -146 | 379 -61 | 0 0 | 0 0 | 0 0 |
| 2019-20 | 899 132 | 899 132 | 504 116 | 395 16 | 0 0 | 0 0 | 0 0 |
| 2020-21 | 1,110 211 | 1,110 211 | 570 66 | 540 145 | 0 0 | 0 0 | 0 0 |
| 2021-22 | 1,261 151 | 1,239 129 | 701 131 | 538 -2 | 22 22 | 9 9 | 13 13 |
| 2022-23 | 1,108 -153 | 1,085 -154 | 539 -162 | 546 8 | 23 1 | 9 0 | 14 1 |
| Average | 1,057 | 1,053 | 553 | 500 | 4 | 2 | 2 |