Enrollment Trends at Sacred Heart Major Seminary

-114

Total Enrollment

-44

Men

-70

Women

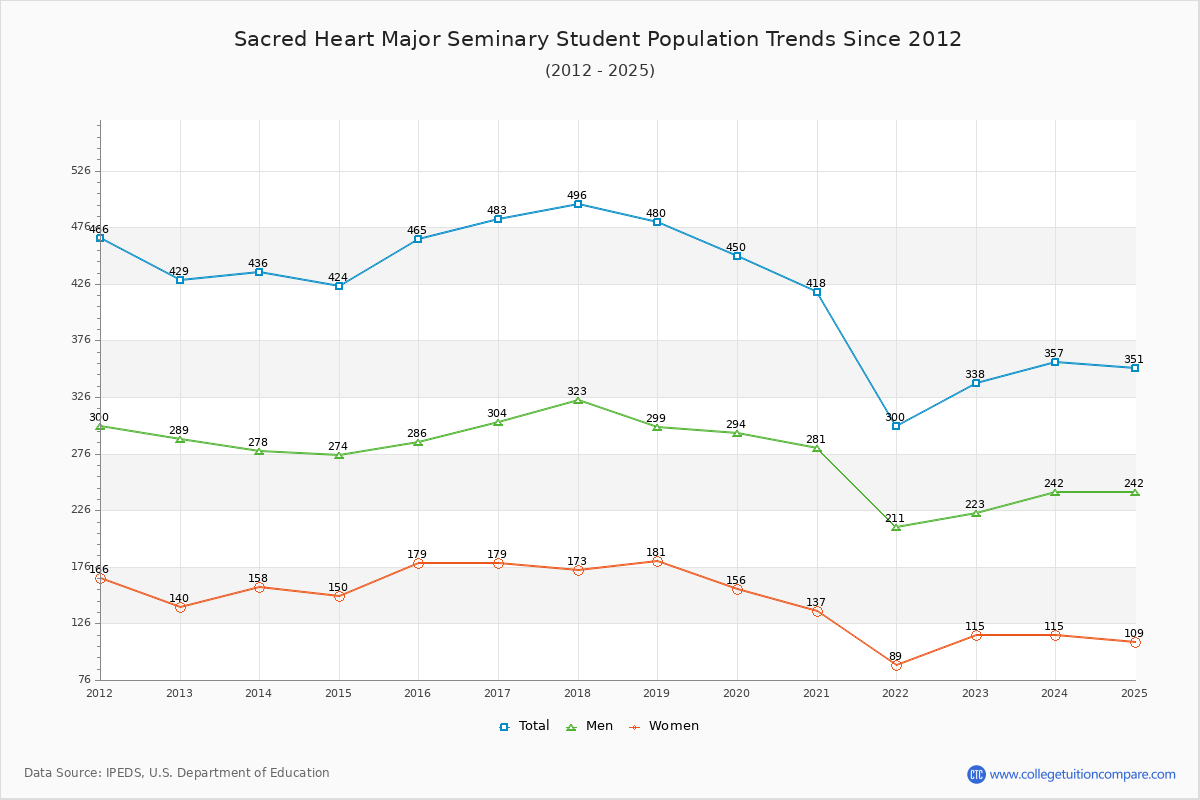
The student population at Sacred Heart Major Seminary is 351 (188 undergraduate and 163 graduate students) . The number of students has decreased by 114 over the past decade.

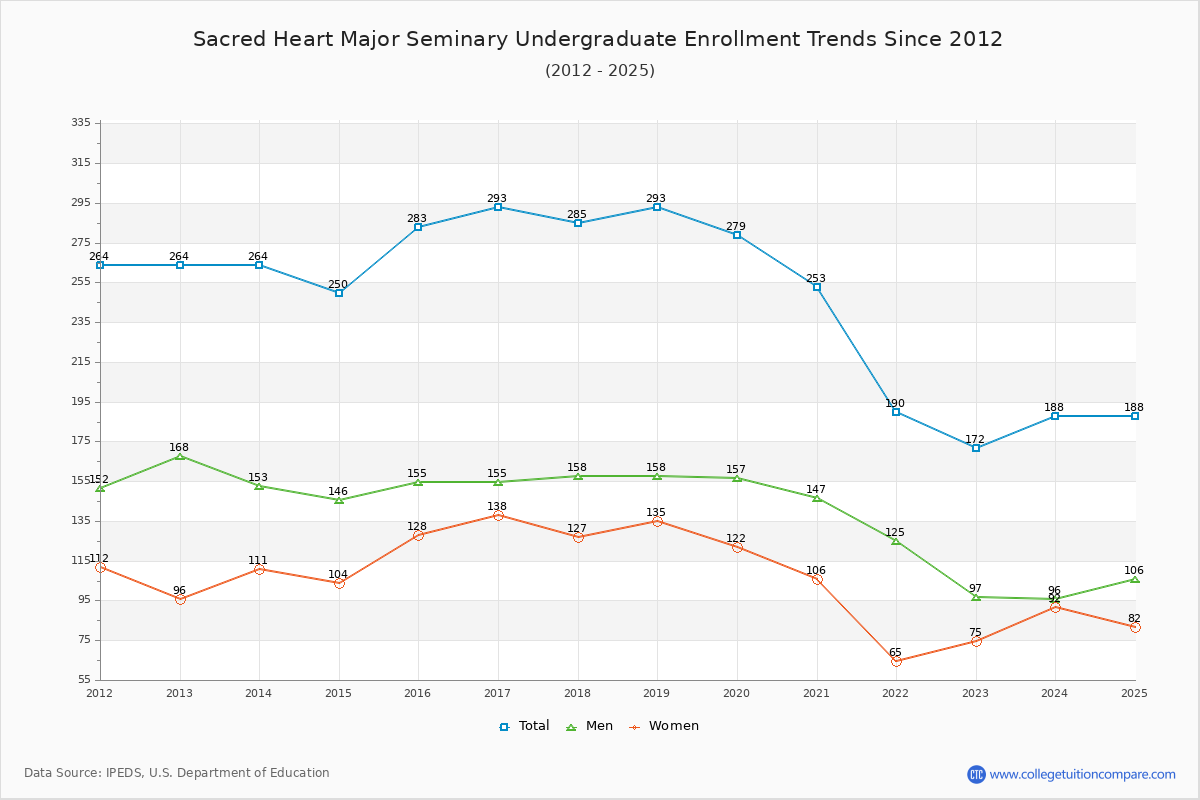
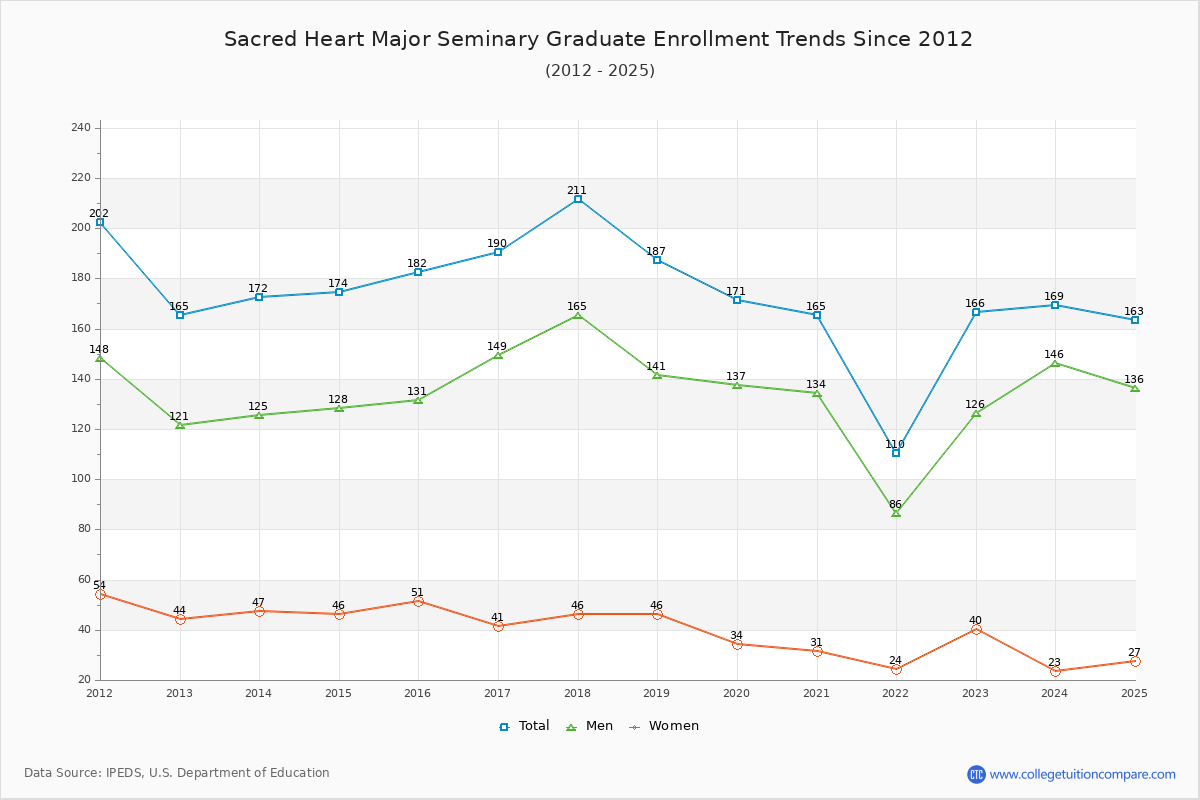
The percentage of undergraduate students at Sacred Heart Major Seminary is 53.56% which is decreased by 95 over last 10 years. The graduate student population decreased by 19 and it has been decreasing.

The female to male ratio is 0.45 to 1 which means that majority of population is on male students.

112 students enrolled in online degree program exclusively and the number of online students has increased by 85.71% since 2015.

Student Population Changes

The average student population over the last 11 years is 414 where 351 students are attending the school for the academic year 2024-2025.

53.56% of total students is undergraduate students and 46.44% students is graduate students. The number of undergraduate students has decreased by 95 and the graduate enrollment has decreased by 19 over past 10 years.

The female to male ratio is 0.45 to 1 and it means that there are far more male students enrolled in Sacred Heart Major Seminary than female students.

The following table and chart illustrate the changes in student population by gender at Sacred Heart Major Seminary since 2015.

YearTotalUndergraduateGraduate
TotalMenWomenTotalMenWomen
2015-1646528315512818213151
2016-17483
18
293
10
155138
10
190
8
149
18
41
-10
2017-18496
13
285
-8
158
3
127
-11
211
21
165
16
46
5
2018-19480
-16
293
8
158135
8
187
-24
141
-24
46
2019-20450
-30
279
-14
157
-1
122
-13
171
-16
137
-4
34
-12
2020-21418
-32
253
-26
147
-10
106
-16
165
-6
134
-3
31
-3
2021-22300
-118
190
-63
125
-22
65
-41
110
-55
86
-48
24
-7
2022-23338
38
172
-18
97
-28
75
10
166
56
126
40
40
16
2023-24357
19
188
16
96
-1
92
17
169
3
146
20
23
-17
2024-25351
-6
188106
10
82
-10
163
-6
136
-10
27
4
Average41424213510717113536
Sacred Heart Major Seminary Enrollment Trends Chart

Undergraduate Enrollment Changes

The average number of Undergraduate students over the last 11 years is 242 where 188 students are attending the Undergraduate school for the academic year 2024-2025. The following table and chart illustrate the changes in Undergraduate enrollment by attending status and gender at Sacred Heart Major Seminary since 2015.

YearTotalFull-timePart-time
TotalMenWomenTotalMenWomen
2015-1628356542227101126
2016-1729355532238102136
2017-1828557561228102126
2018-192936161023297135
2019-2027954513225106119
2020-212537573217874104
2021-22190484711427864
2022-23172333211396574
2023-24188282801606892
2024-25188272701617982
Average24224248124287106
Sacred Heart Major Seminary Undergraduate Enrollment Trends Chart

Graduate Enrollment Changes

The average number of Graduate students over the last 11 years is 171 where 163 students are attending the Graduate school for the academic year 2024-2025. The following table and chart illustrate the changes in Graduate enrollment by attending status and gender at Sacred Heart Major Seminary since 2015.

YearTotalFull-timePart-time
TotalMenWomenTotalMenWomen
2015-16182646041187147
2016-17190595361319635
2017-182116359414810642
2018-19187555411328745
2019-20171575701148034
2020-21165605911057530
2021-2211046451644123
2022-23166656411016239
2023-24169646401058223
2024-25163585801057827
Average1711715721717835
Sacred Heart Major Seminary Graduate Enrollment Trends Chart

Enrollment by Race/Ethnicity Changes

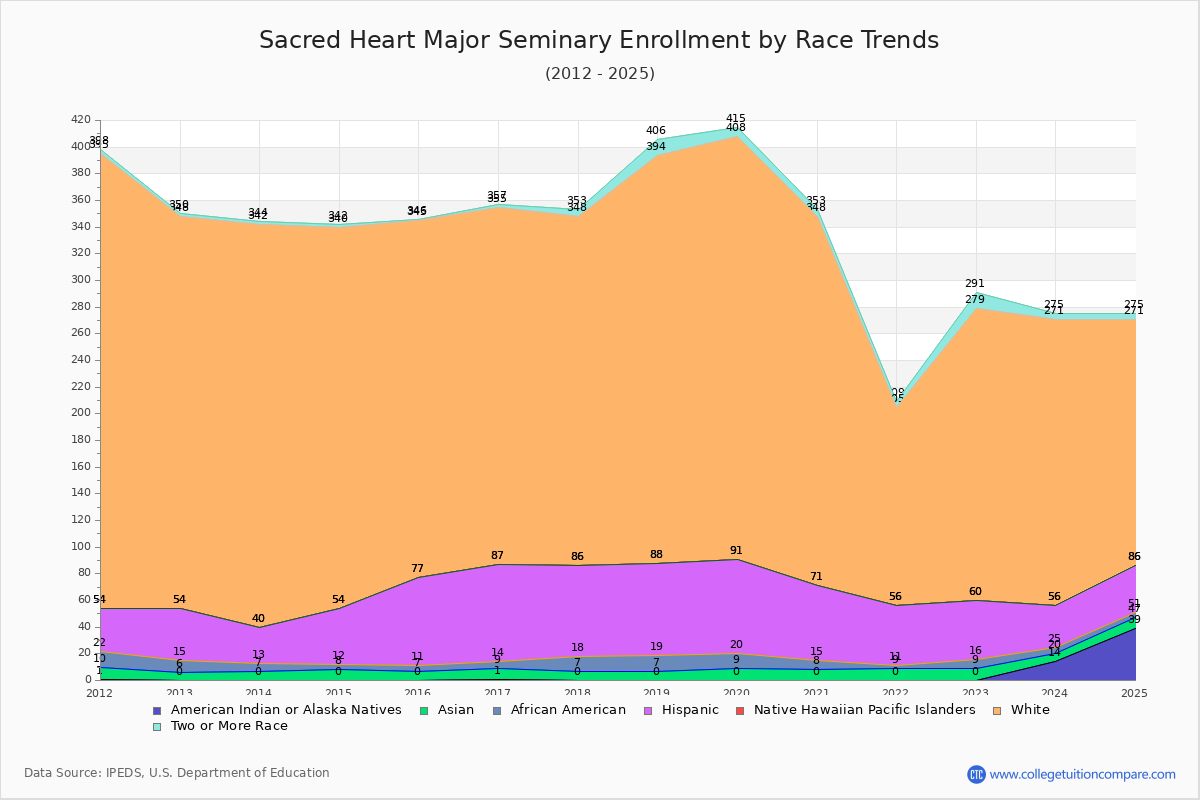
The percentage of white students is 52.71%. The percentage was 57.63% 10 years ago and Sacred Heart Major Seminary still has a high percentage of white students. 2.28% of enrolled students is Asian and 1.14% is black students. Hispanic students comprise 9.97% of the student body.

Over the past 10 years, the racial composition has shifted. The percentage of white students decreased from 57.63% to 52.71%. Asian enrollment grew from 1.51% to 2.28%. Black student enrollment increased from 0.86% to 1.14%. Hispanic student representation contracted from 14.19% to 9.97%.

The overall racial diversity, measured by the Census Bureau Diversity Index, is 0.6991 which indicates that moderately diverse. This increased from 0.6474 a decade ago, suggesting that racial diversity has improved.

The following table and chart illustrate the student population trends by race/ethnicity at Sacred Heart Major Seminary over the past 11 years (2015-2025).

YearAmerican Indian or Native AmericanAsianBlackHispanicNative Hawaiian or Other Pacific IslanderWhiteTwo or More Races
2015-160746602681
2016-171857302682
2017-1807116802625
2018-19071269030612
2019-2009117103177
2020-210875602775
2021-220924501494
2022-2309744021912
2023-2414653102154
2024-2539843501854
Average5875602476
Sacred Heart Major Seminary Enrollment by Race Trends Chart

Distance Learning (Online Courses) Enrollment Changes

112 students are enrolled in online degree programs exclusively for the academic year 2024-2025, which is 32% of total students. The number of online students has increased 85.71% since 2015. The following table and chart illustrate the changes in the online student population by enrolled type at Sacred Heart Major Seminary from 2015 to 2025.

YearTotal EnrollmentOnline CompletelyEnrolled in Some Online CoursesNot Enrolled in Online Courses
2015-16465021444
2016-17483043440
2017-18496046450
2018-194806414402
2019-2045025140285
2020-2141812150256
2021-223005747196
2022-2333853179106
2023-243579230235
2024-2535111239200
Average4144271301

Ratings & Review

Share your experiences and thoughts about Sacred Heart Major Seminary. It will be a great help to applicants and prospective students!