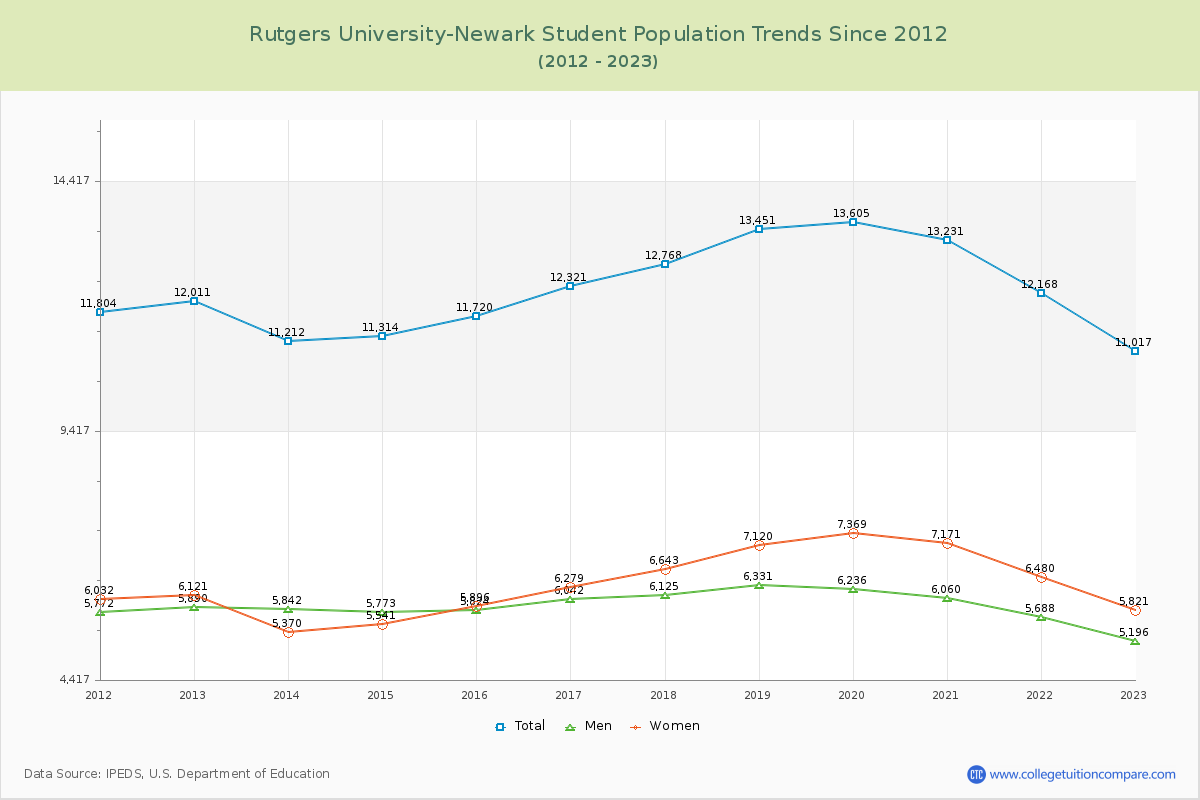
Student Population Changes
The average student population over the last 12 years is 12,256 where 11,017 students are attending the school for the academic year 2022-2023.
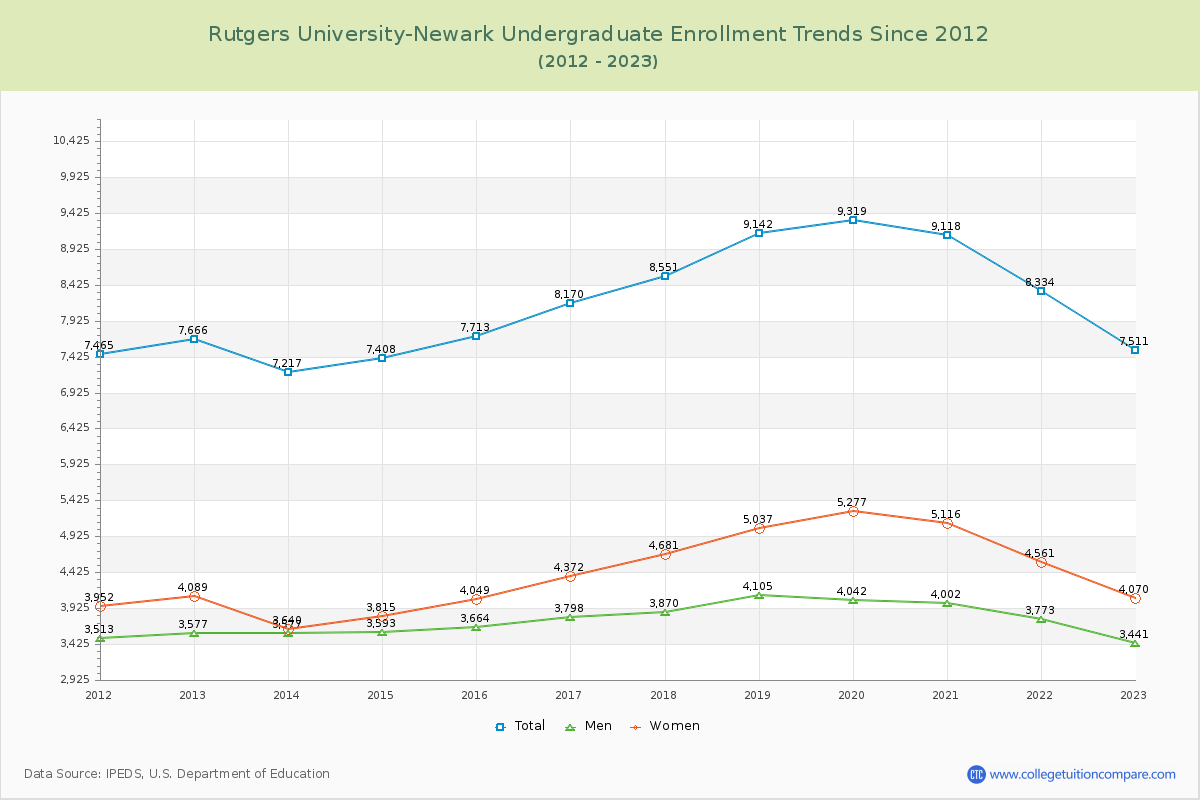
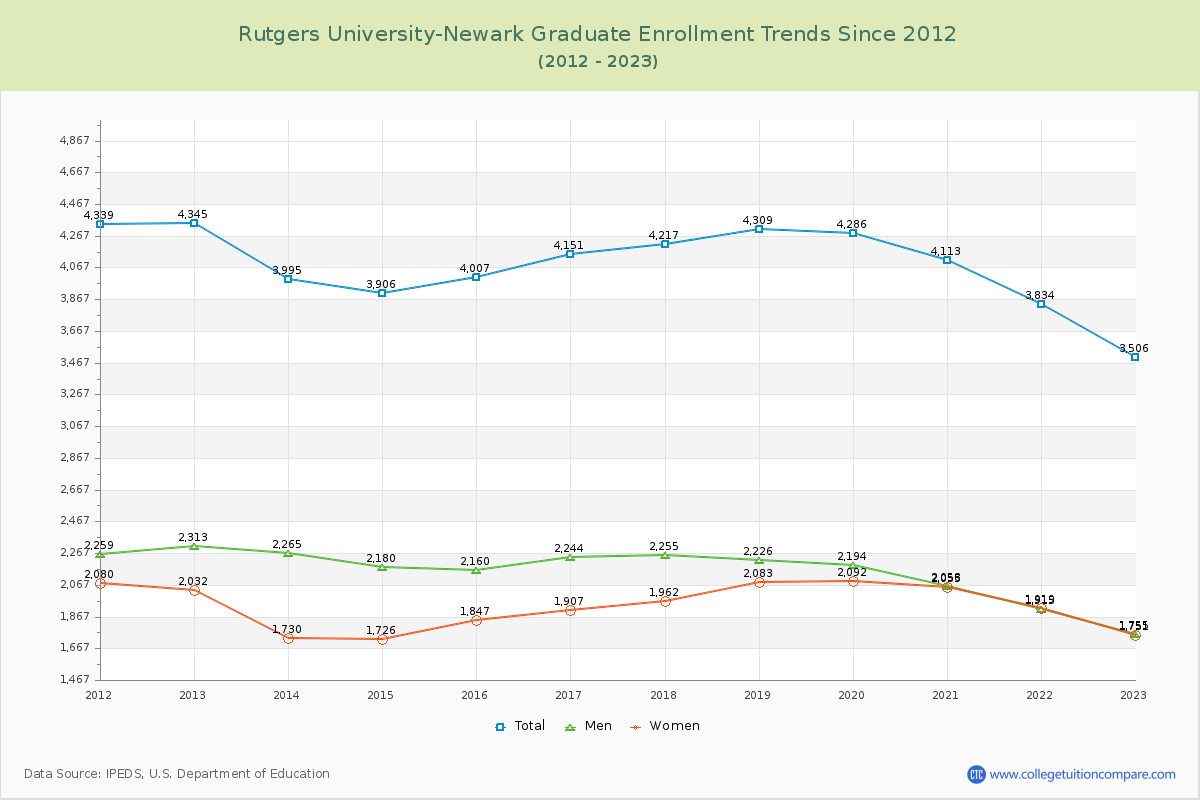
68.18% of total students is undergraduate students and 31.82% students is graduate students. The number of undergraduate students has decreased by 155 and the graduate enrollment has decreased by 839 over past 10 years.
The female to male ratio is 1.12 to 1 and it means that there are slightly more female students enrolled in Rutgers-Newark than male students.
The following table and chart illustrate the changes in student population by gender at Rutgers University-Newark since 2012.
| Year | Total | Undergraduate | Graduate | ||||
|---|---|---|---|---|---|---|---|
| Total | Men | Women | Total | Men | Women | ||
| 2012-13 | 12,011 | 7,666 | 3,577 | 4,089 | 4,345 | 2,313 | 2,032 |
| 2013-14 | 11,212 -799 | 7,217 -449 | 3,577 0 | 3,640 -449 | 3,995 -350 | 2,265 -48 | 1,730 -302 |
| 2014-15 | 11,314 102 | 7,408 191 | 3,593 16 | 3,815 175 | 3,906 -89 | 2,180 -85 | 1,726 -4 |
| 2015-16 | 11,720 406 | 7,713 305 | 3,664 71 | 4,049 234 | 4,007 101 | 2,160 -20 | 1,847 121 |
| 2016-17 | 12,321 601 | 8,170 457 | 3,798 134 | 4,372 323 | 4,151 144 | 2,244 84 | 1,907 60 |
| 2017-18 | 12,768 447 | 8,551 381 | 3,870 72 | 4,681 309 | 4,217 66 | 2,255 11 | 1,962 55 |
| 2018-19 | 13,451 683 | 9,142 591 | 4,105 235 | 5,037 356 | 4,309 92 | 2,226 -29 | 2,083 121 |
| 2019-20 | 13,605 154 | 9,319 177 | 4,042 -63 | 5,277 240 | 4,286 -23 | 2,194 -32 | 2,092 9 |
| 2020-21 | 13,231 -374 | 9,118 -201 | 4,002 -40 | 5,116 -161 | 4,113 -173 | 2,058 -136 | 2,055 -37 |
| 2021-22 | 12,168 -1,063 | 8,334 -784 | 3,773 -229 | 4,561 -555 | 3,834 -279 | 1,915 -143 | 1,919 -136 |
| 2022-23 | 11,017 -1,151 | 7,511 -823 | 3,441 -332 | 4,070 -491 | 3,506 -328 | 1,755 -160 | 1,751 -168 |
| Average | 12,256 | 8,195 | 3,767 | 4,428 | 4,061 | 2,142 | 1,919 |