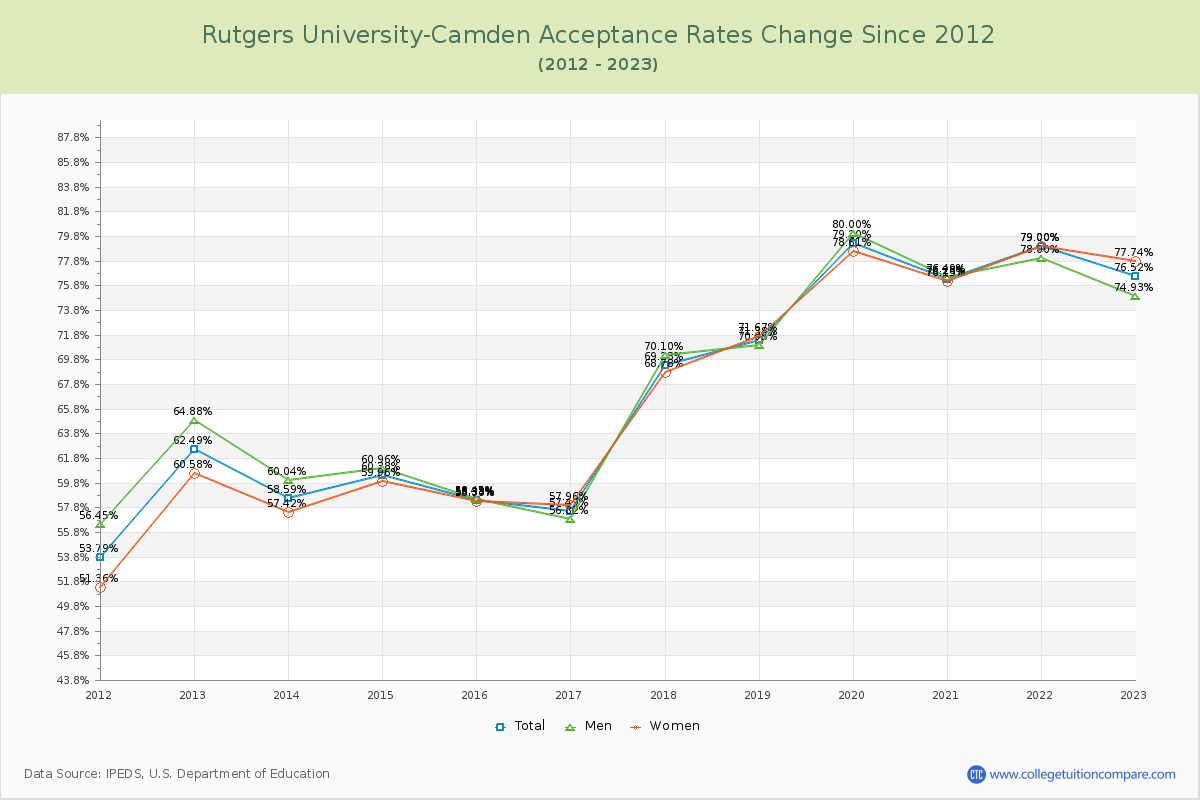
Acceptance Rate Changes
The average acceptance rate over the last 10 years is 68.09%, and this year's acceptance rate is 76.52% at Rutgers University-Camden. By gender, men students' acceptance rate is 68.33% and women students' rate is 67.84%. For 2023 admission, it was slightly harder to get into Rutgers University-Camden than the previous year.
The next table and chart illustrate the acceptance rates changes at Rutgers University-Camden over the past 11 years (2012-2023).
| Year | Total | Men | Women |
|---|---|---|---|
| 2012-13 | 62.49% | 64.88% | 60.58% |
| 2013-14 | 58.59% -3.90% |
60.04% -3.15% |
57.42% -3.15% |
| 2014-15 | 60.38% 1.80% |
60.96% 2.54% |
59.96% 2.54% |
| 2015-16 | 58.38% -2.00% |
58.45% -1.63% |
58.33% -1.63% |
| 2016-17 | 57.49% -0.89% |
56.82% -0.37% |
57.96% -0.37% |
| 2017-18 | 69.33% 11.84% |
70.10% 10.82% |
68.78% 10.82% |
| 2018-19 | 71.38% 2.05% |
70.95% 2.89% |
71.67% 2.89% |
| 2019-20 | 79.20% 7.82% |
80.00% 6.94% |
78.61% 6.94% |
| 2020-21 | 76.28% -2.92% |
76.49% -2.46% |
76.15% -2.46% |
| 2021-22 | 79.00% 2.71% |
78.00% 2.86% |
79.00% 2.86% |
| 2022-23 | 76.52% -2.48% |
74.93% -1.27% |
77.74% -1.27% |
| Average | 68.09% | 68.33% | 67.84% |