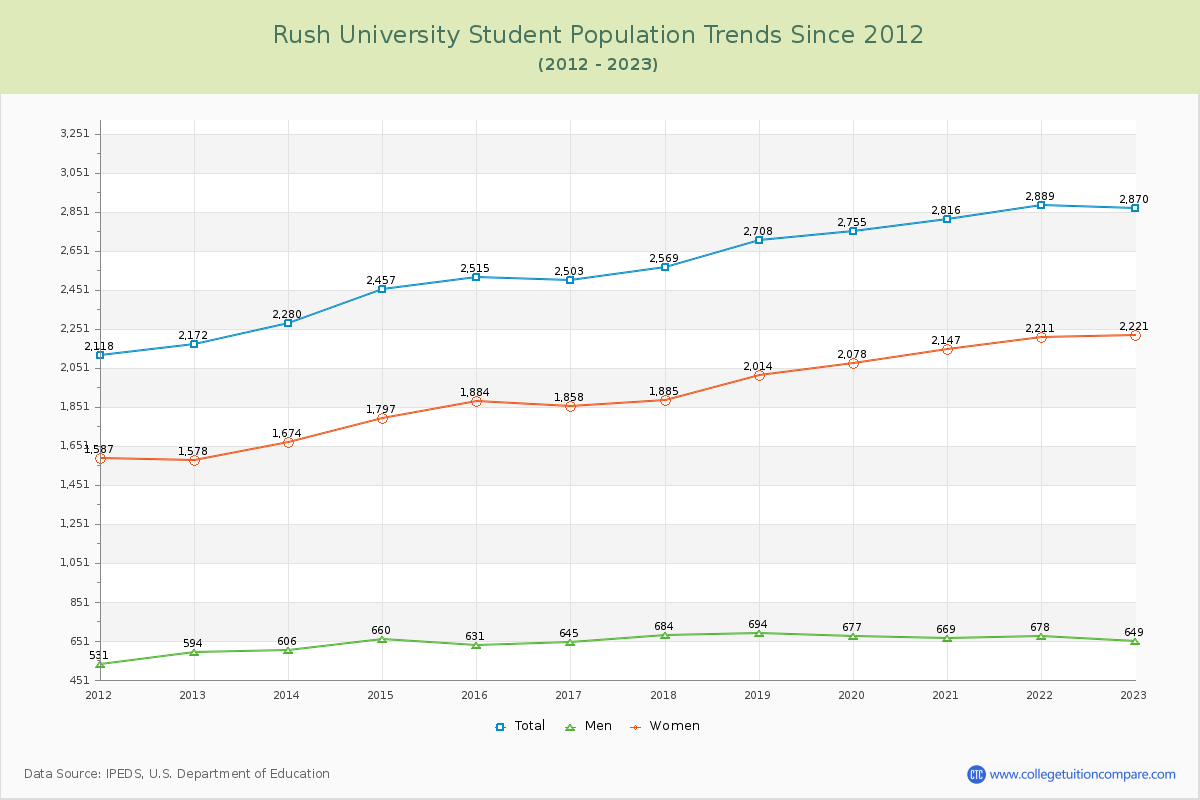
Student Population Changes
The average student population over the last 12 years is 2,594 where 2,870 students are attending the school for the academic year 2022-2023.
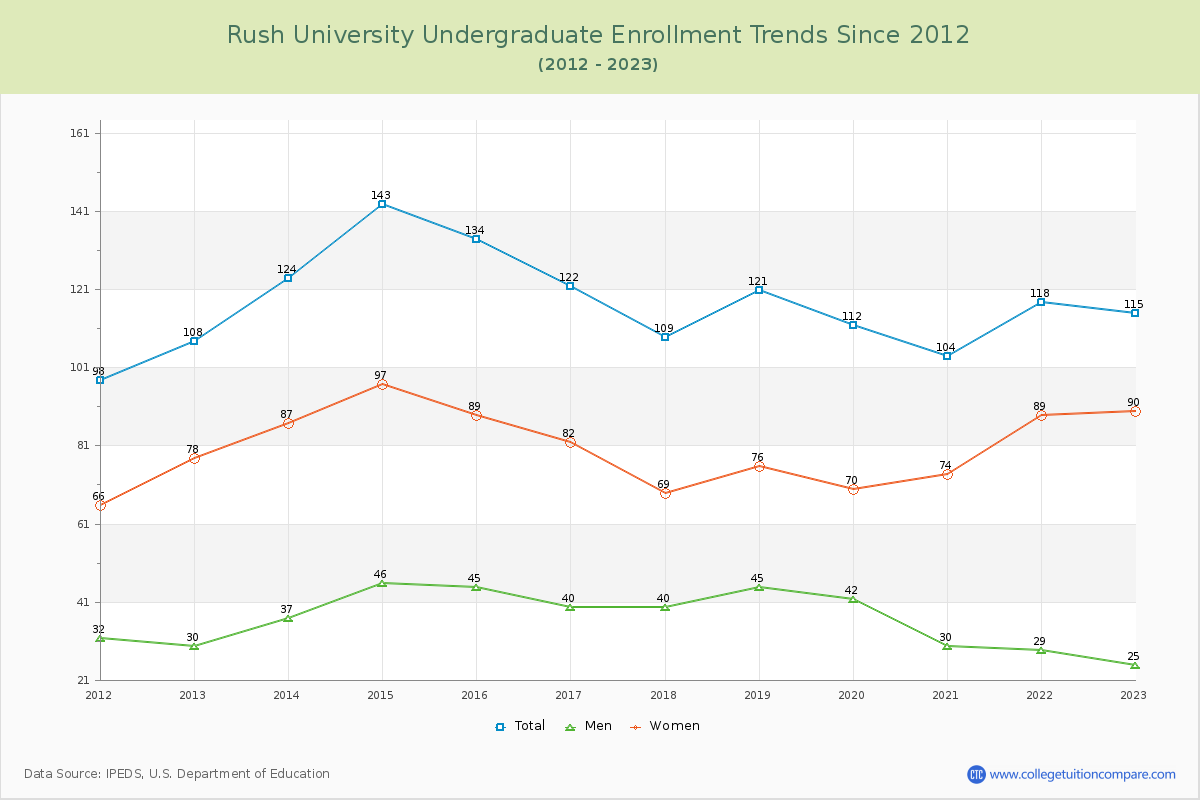
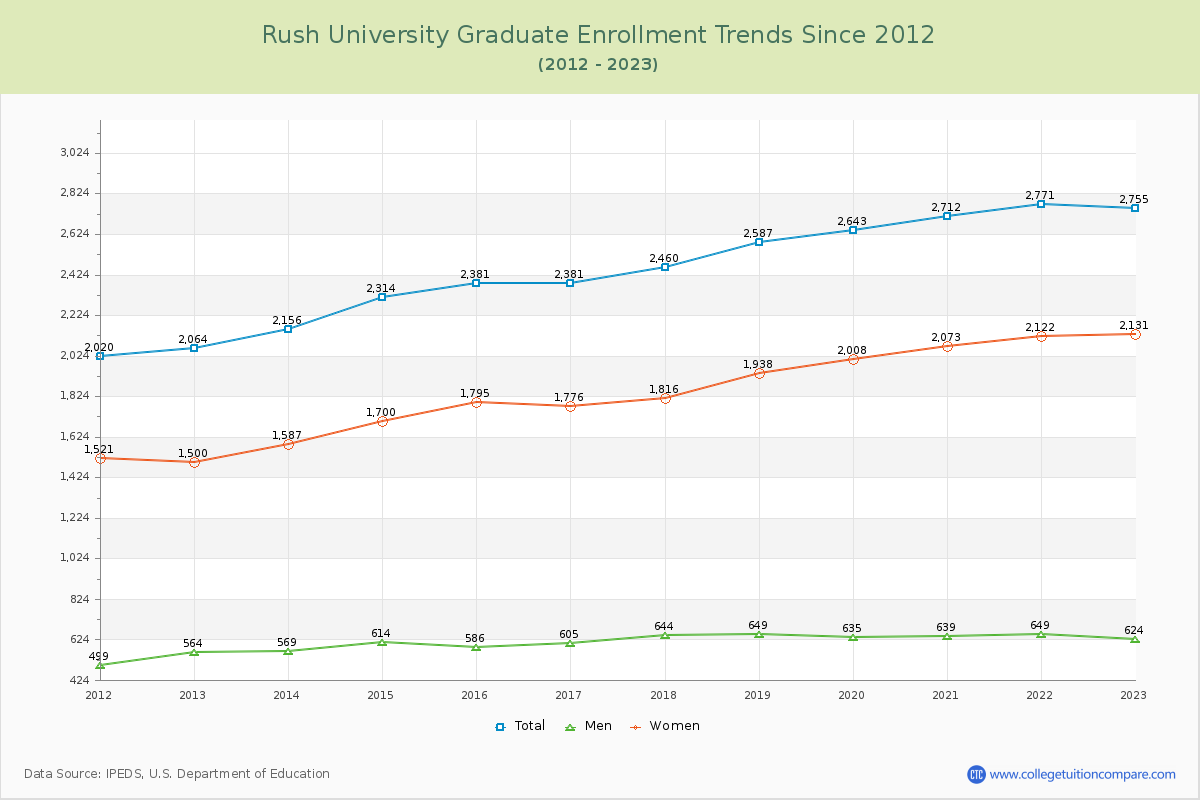
4.01% of total students is undergraduate students and 95.99% students is graduate students. The number of undergraduate students has increased by 7 and the graduate enrollment has increased by 691 over past 10 years.
The female to male ratio is 3.42 to 1 and it means that there are far more female students enrolled in Rush than male students.
The following table and chart illustrate the changes in student population by gender at Rush University since 2012.
| Year | Total | Undergraduate | Graduate | ||||
|---|---|---|---|---|---|---|---|
| Total | Men | Women | Total | Men | Women | ||
| 2012-13 | 2,172 | 108 | 30 | 78 | 2,064 | 564 | 1,500 |
| 2013-14 | 2,280 108 | 124 16 | 37 7 | 87 9 | 2,156 92 | 569 5 | 1,587 87 |
| 2014-15 | 2,457 177 | 143 19 | 46 9 | 97 10 | 2,314 158 | 614 45 | 1,700 113 |
| 2015-16 | 2,515 58 | 134 -9 | 45 -1 | 89 -8 | 2,381 67 | 586 -28 | 1,795 95 |
| 2016-17 | 2,503 -12 | 122 -12 | 40 -5 | 82 -7 | 2,381 0 | 605 19 | 1,776 -19 |
| 2017-18 | 2,569 66 | 109 -13 | 40 0 | 69 -13 | 2,460 79 | 644 39 | 1,816 40 |
| 2018-19 | 2,708 139 | 121 12 | 45 5 | 76 7 | 2,587 127 | 649 5 | 1,938 122 |
| 2019-20 | 2,755 47 | 112 -9 | 42 -3 | 70 -6 | 2,643 56 | 635 -14 | 2,008 70 |
| 2020-21 | 2,816 61 | 104 -8 | 30 -12 | 74 4 | 2,712 69 | 639 4 | 2,073 65 |
| 2021-22 | 2,889 73 | 118 14 | 29 -1 | 89 15 | 2,771 59 | 649 10 | 2,122 49 |
| 2022-23 | 2,870 -19 | 115 -3 | 25 -4 | 90 1 | 2,755 -16 | 624 -25 | 2,131 9 |
| Average | 2,594 | 119 | 37 | 82 | 2,475 | 616 | 1,859 |