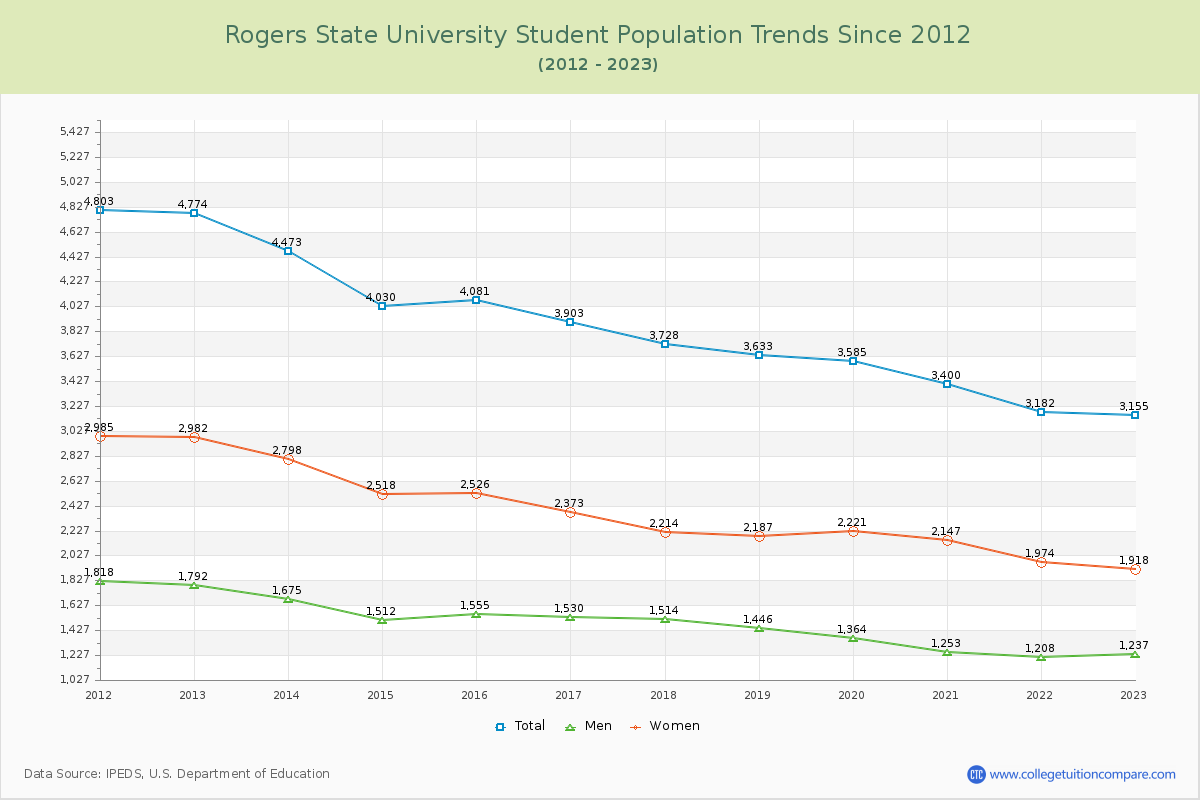
Student Population Changes
The average student population over the last 12 years is 3,813 where 3,155 students are attending the school for the academic year 2022-2023.
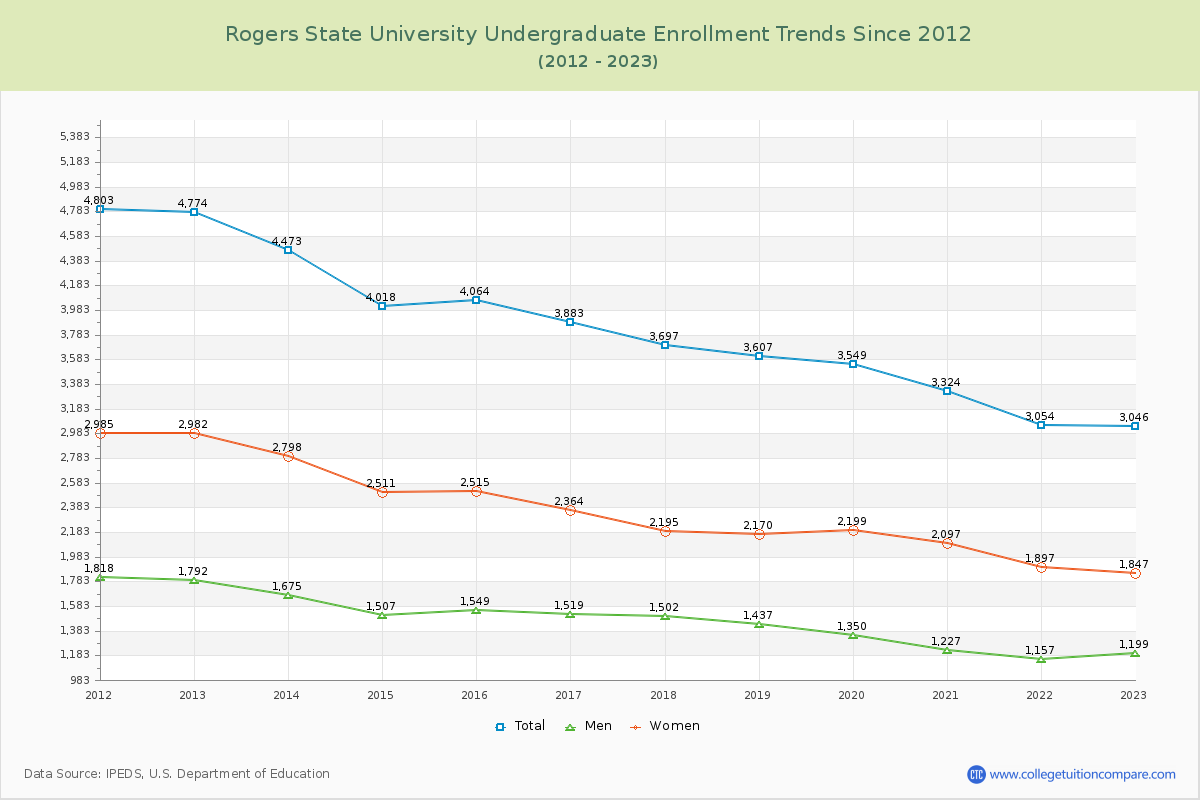
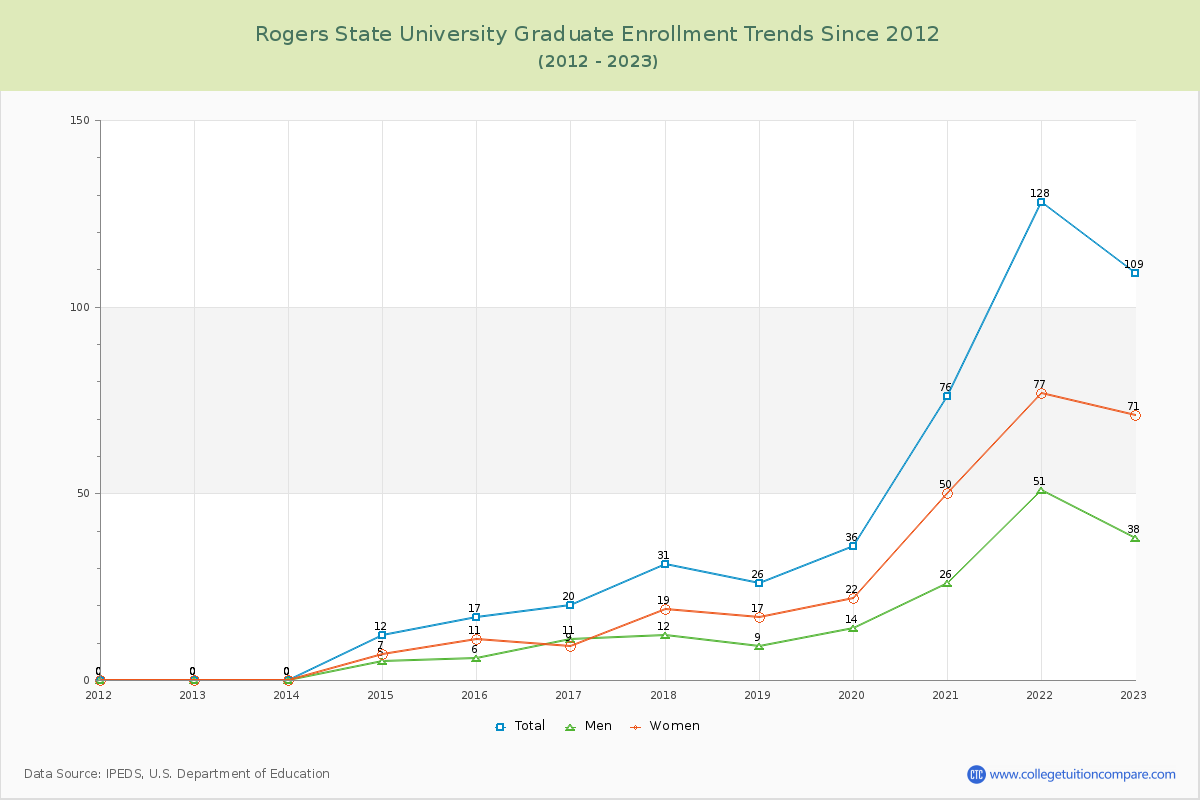
96.55% of total students is undergraduate students and 3.45% students is graduate students. The number of undergraduate students has decreased by 1,728 and the graduate enrollment has increased by 109 over past 10 years.
The female to male ratio is 1.55 to 1 and it means that there are more female students enrolled in RSU than male students.
The following table and chart illustrate the changes in student population by gender at Rogers State University since 2012.
| Year | Total | Undergraduate | Graduate | ||||
|---|---|---|---|---|---|---|---|
| Total | Men | Women | Total | Men | Women | ||
| 2012-13 | 4,774 | 4,774 | 1,792 | 2,982 | 0 | 0 | 0 |
| 2013-14 | 4,473 -301 | 4,473 -301 | 1,675 -117 | 2,798 -184 | 0 0 | 0 0 | 0 0 |
| 2014-15 | 4,030 -443 | 4,018 -455 | 1,507 -168 | 2,511 -287 | 12 12 | 5 5 | 7 7 |
| 2015-16 | 4,081 51 | 4,064 46 | 1,549 42 | 2,515 4 | 17 5 | 6 1 | 11 4 |
| 2016-17 | 3,903 -178 | 3,883 -181 | 1,519 -30 | 2,364 -151 | 20 3 | 11 5 | 9 -2 |
| 2017-18 | 3,728 -175 | 3,697 -186 | 1,502 -17 | 2,195 -169 | 31 11 | 12 1 | 19 10 |
| 2018-19 | 3,633 -95 | 3,607 -90 | 1,437 -65 | 2,170 -25 | 26 -5 | 9 -3 | 17 -2 |
| 2019-20 | 3,585 -48 | 3,549 -58 | 1,350 -87 | 2,199 29 | 36 10 | 14 5 | 22 5 |
| 2020-21 | 3,400 -185 | 3,324 -225 | 1,227 -123 | 2,097 -102 | 76 40 | 26 12 | 50 28 |
| 2021-22 | 3,182 -218 | 3,054 -270 | 1,157 -70 | 1,897 -200 | 128 52 | 51 25 | 77 27 |
| 2022-23 | 3,155 -27 | 3,046 -8 | 1,199 42 | 1,847 -50 | 109 -19 | 38 -13 | 71 -6 |
| Average | 3,813 | 3,772 | 1,447 | 2,325 | 41 | 16 | 26 |