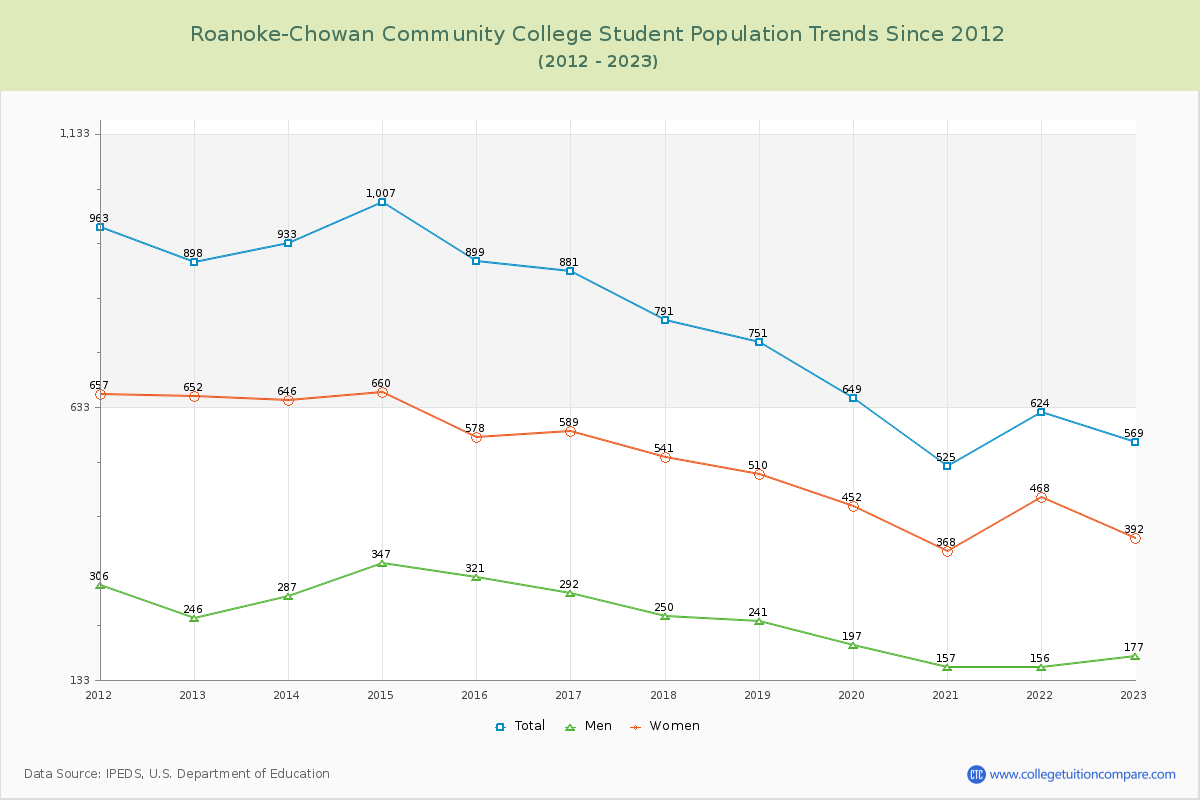
Student Population Changes
The average student population over the last 12 years is 775 where 569 students are attending the school for the academic year 2022-2023.
The female to male ratio is 2.21 to 1 and it means that there are far more female students enrolled in RCCC than male students.
The following table and chart illustrate the changes in student population by gender at Roanoke-Chowan Community College since 2012.
| Year | Total | Men | Women |
|---|---|---|---|
| 2012-13 | 898 | 246 | 652 |
| 2013-14 | 933 35 | 287 41 | 646 -6 |
| 2014-15 | 1,007 74 | 347 60 | 660 14 |
| 2015-16 | 899 -108 | 321 -26 | 578 -82 |
| 2016-17 | 881 -18 | 292 -29 | 589 11 |
| 2017-18 | 791 -90 | 250 -42 | 541 -48 |
| 2018-19 | 751 -40 | 241 -9 | 510 -31 |
| 2019-20 | 649 -102 | 197 -44 | 452 -58 |
| 2020-21 | 525 -124 | 157 -40 | 368 -84 |
| 2021-22 | 624 99 | 156 -1 | 468 100 |
| 2022-23 | 569 -55 | 177 21 | 392 -76 |
| Average | 775 | 243 | 532 |