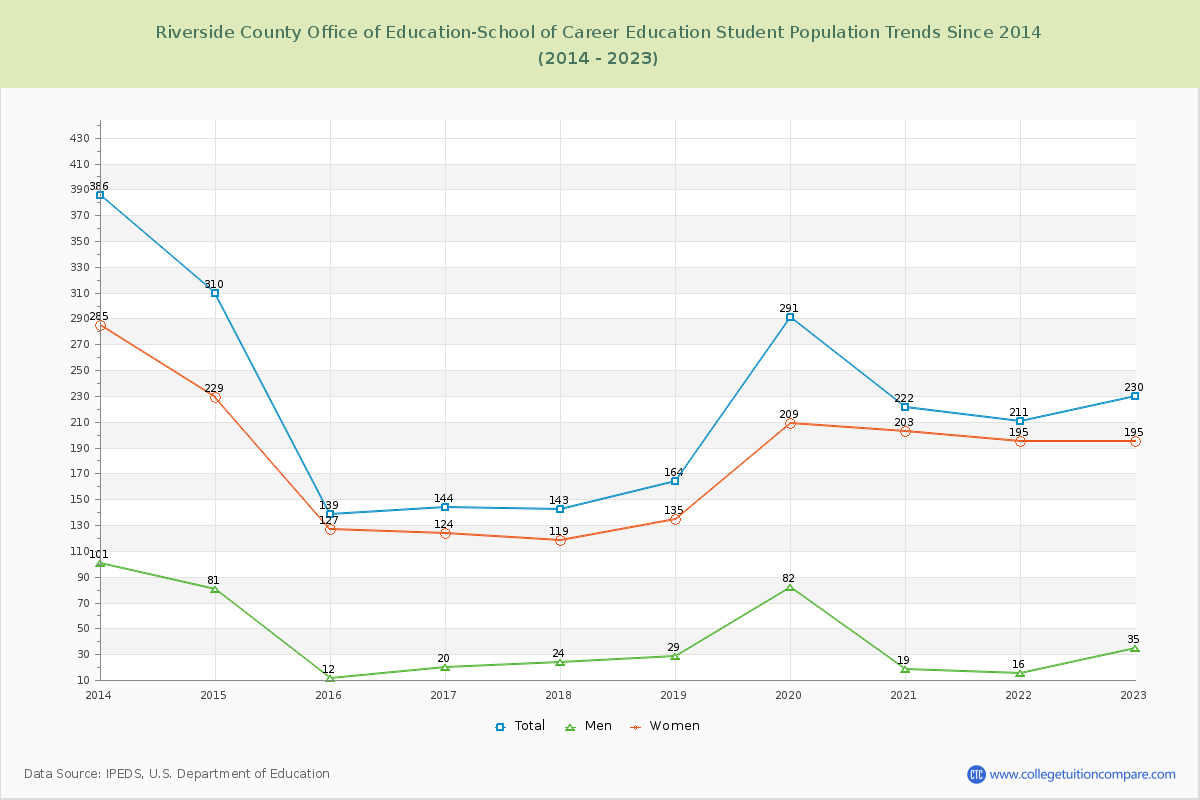
Student Population Changes
The average student population over the last 11 years is 224 where 230 students are attending the school for the academic year 2022-2023.
The female to male ratio is 5.57 to 1 and it means that there are far more female students enrolled in RCOE SCE than male students.
The following table and chart illustrate the changes in student population by gender at Riverside County Office of Education-School of Career Education since 2013.
| Year | Total | Men | Women |
|---|---|---|---|
| 2013-14 | 386 | 101 | 285 |
| 2014-15 | 310 -76 | 81 -20 | 229 -56 |
| 2015-16 | 139 -171 | 12 -69 | 127 -102 |
| 2016-17 | 144 5 | 20 8 | 124 -3 |
| 2017-18 | 143 -1 | 24 4 | 119 -5 |
| 2018-19 | 164 21 | 29 5 | 135 16 |
| 2019-20 | 291 127 | 82 53 | 209 74 |
| 2020-21 | 222 -69 | 19 -63 | 203 -6 |
| 2021-22 | 211 -11 | 16 -3 | 195 -8 |
| 2022-23 | 230 19 | 35 19 | 195 0 |
| Average | 224 | 42 | 182 |