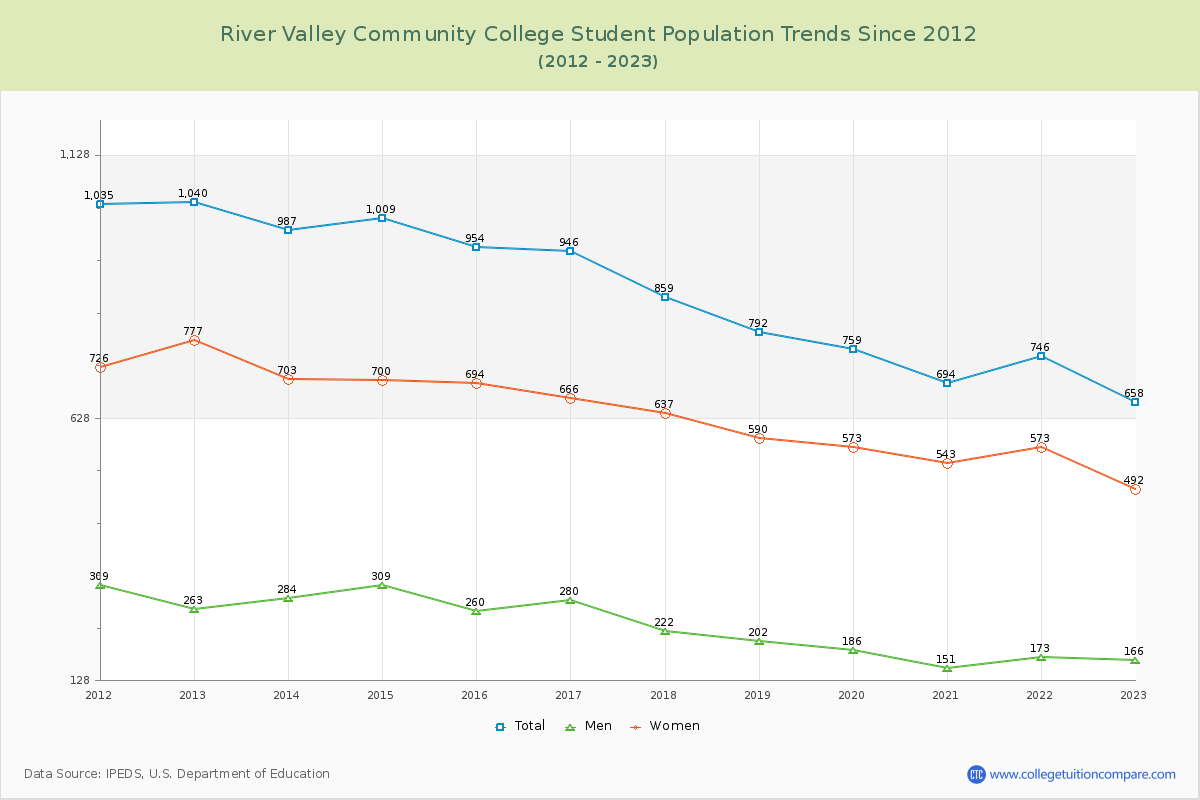
Student Population Changes
The average student population over the last 12 years is 859 where 658 students are attending the school for the academic year 2022-2023.
The female to male ratio is 2.96 to 1 and it means that there are far more female students enrolled in River Valley CC than male students.
The following table and chart illustrate the changes in student population by gender at River Valley Community College since 2012.
| Year | Total | Men | Women |
|---|---|---|---|
| 2012-13 | 1,040 | 263 | 777 |
| 2013-14 | 987 -53 | 284 21 | 703 -74 |
| 2014-15 | 1,009 22 | 309 25 | 700 -3 |
| 2015-16 | 954 -55 | 260 -49 | 694 -6 |
| 2016-17 | 946 -8 | 280 20 | 666 -28 |
| 2017-18 | 859 -87 | 222 -58 | 637 -29 |
| 2018-19 | 792 -67 | 202 -20 | 590 -47 |
| 2019-20 | 759 -33 | 186 -16 | 573 -17 |
| 2020-21 | 694 -65 | 151 -35 | 543 -30 |
| 2021-22 | 746 52 | 173 22 | 573 30 |
| 2022-23 | 658 -88 | 166 -7 | 492 -81 |
| Average | 859 | 227 | 632 |